Solana Corrects Upward, But Risks Drop Below $20 Low
Updated: Aug 07, 2023 at 15:13

Cryptocurrency price analysis brought by Coinidol.com. The price of Solana (SOL) has been declining since July 30 and is currently trapped between moving average lines.
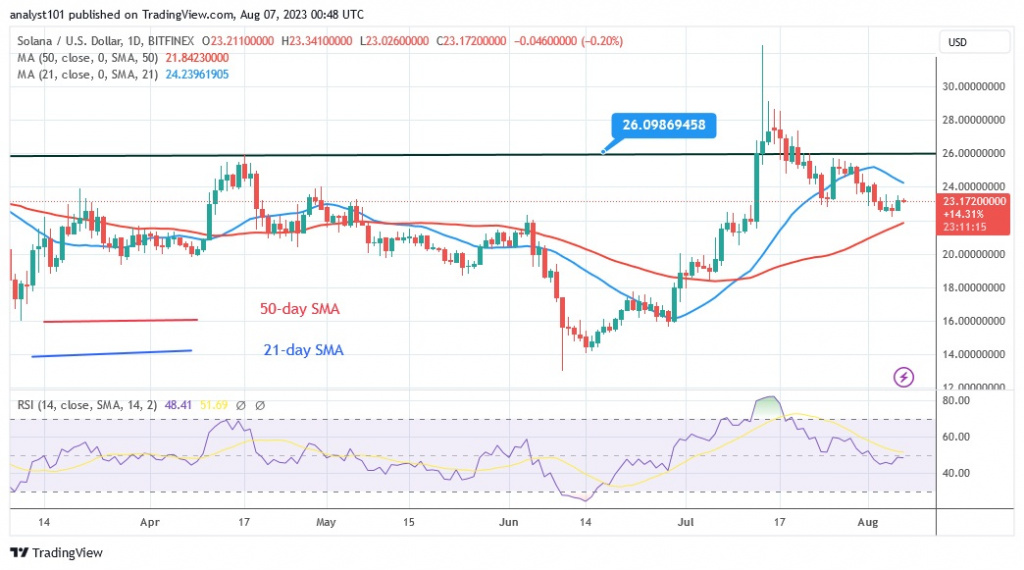
Solana long-term price forecast: bearish
The cryptocurrency fell to a low of $23 before starting to bounce back between the moving average lines. According to the price indication, Solana will fall even further and reach a low of $20.
Now that the 50-day line SMA is above the descending momentum, it is more stable. The price will resume its current downtrend if it falls below the 50-day line SMA. Doji candlesticks are a characteristic feature of altcoin price movement. The expected decline was stopped by the 50-day line SMA. Solana develops when the moving average lines cross.
Solana price indicator analysis
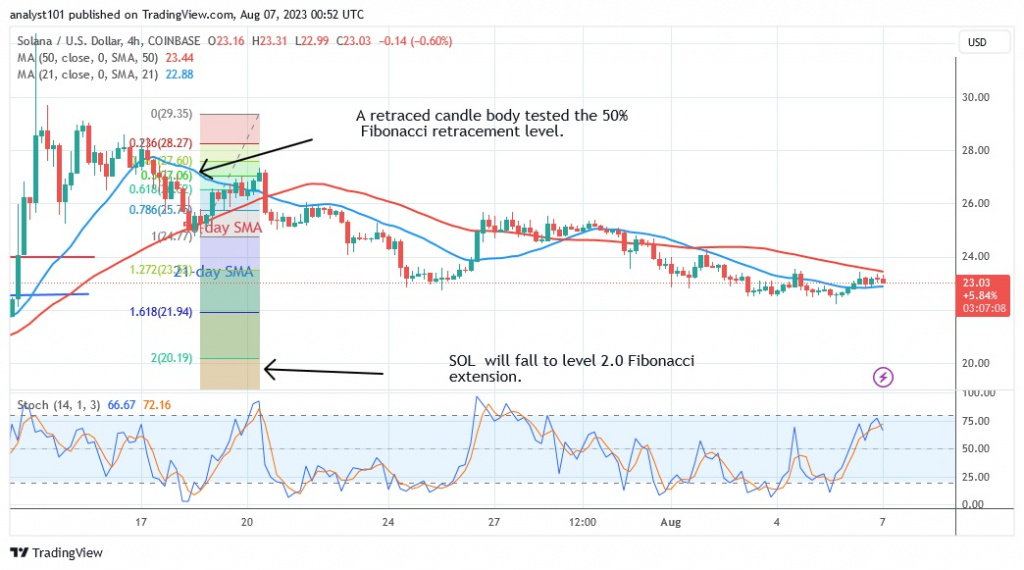
Solana's decline has reached a Relative Strength Index of 48 for the period 14. The altcoin will fall as it approaches the bearish trend zone. As the cryptocurrency is trapped between the moving average lines, a sideways movement is required. The altcoin is gaining as it is above the 75 level of the daily stochastic. When the altcoin reaches the overbought area of the market, it will fall.

Technical Indicators
Key supply zones: $20, $25, $30
Key demand zones: $10, $5, $1
What is the next move for Solana?
Solana reverses to the upside, which leads to an overbought region of the market. Altcoin will fall and continue its sideways movement where it is rejected at the recent high. In the long run, the altcoin will fall below the 50-day simple moving average. If Solana breaks out of the trading range, it will likely reach a low of $20.

On Jul 31, 2023 cryptocurrency analytics specialists of Coinidol.com stated that the altcoin rallied on July 26, breaking through the 21-day line SMA. However, the upper resistance of $26 has stopped Solana's ability to go higher.
Disclaimer. This analysis and forecast are the personal opinions of the author and are not a recommendation to buy or sell cryptocurrency and should not be viewed as an endorsement by CoinIdol.com. Readers should do their own research before investing in funds.
News
Price
Price
Price
Price

(0 comments)