Solana Can Not Overcome $26 High, Threat Of Price Drop

The price of Solana (SOL) is correcting to the upside.
Solana long term price forecast: bullish
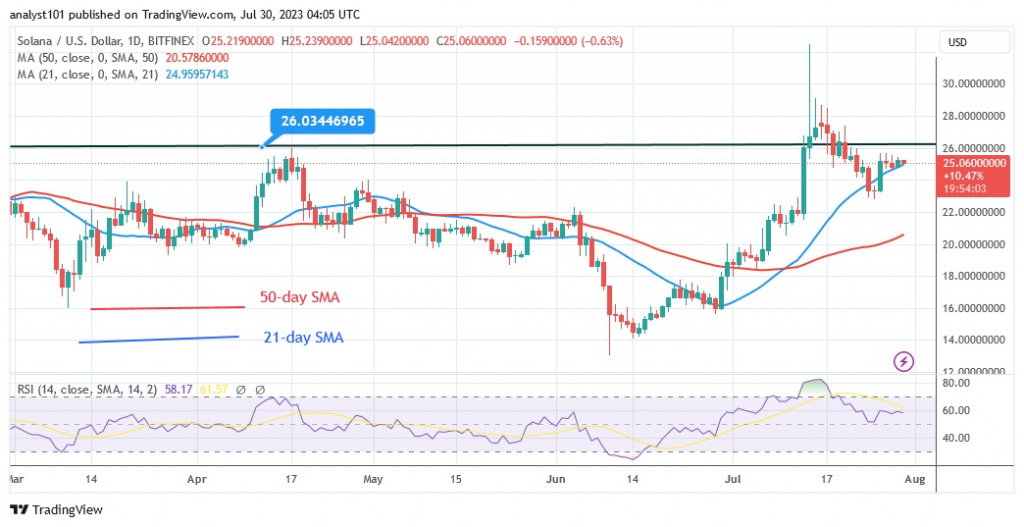
The altcoin rallied on July 26, breaking through the 21-day line SMA. However, the upper resistance of $26 has stopped Solana's ability to go higher. The altcoin has held above the 21-day line SMA for the last five days. Due to the presence of Doji candlesticks, further upward movement of the altcoin seems speculative.
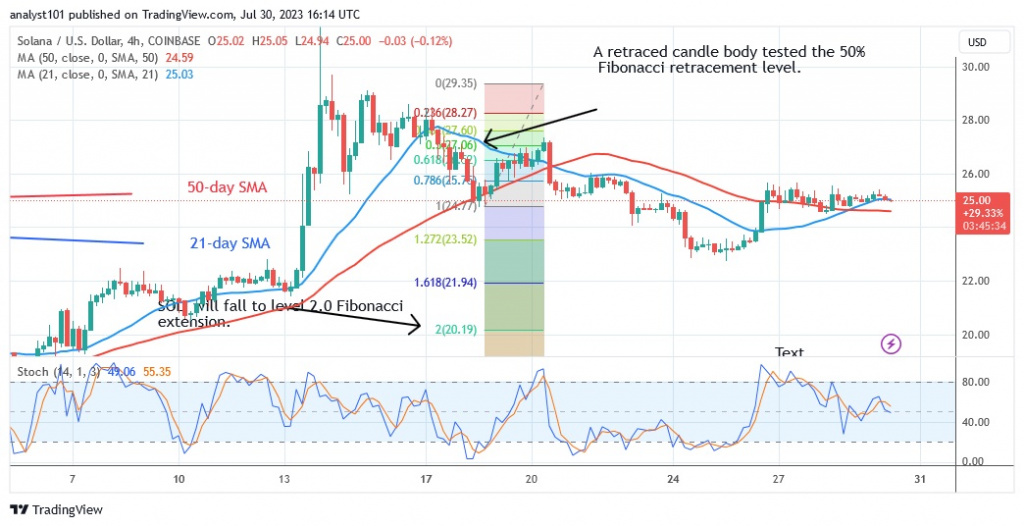
Selling pressure will increase if the bears break below the 21-day line SMA. If the 21-day line SMA is broken, the price will fall to a low above the 50-day line SMA. In other words, Solana will continue to fall until it reaches a low of $20. SOLin the meantime /USD is trading at $25.06.
Solana price indicator analysis
On the Relative Strength Index, Solana is at the 58 level for the 14 period.
Although it is in an uptrend, the altcoin could fall. The price bars are moving above the 21-day line SMA, which could lead to a rise. The bullish momentum of the daily stochastic has weakened above the 40 level. The horizontal slope of the moving average lines suggests a sideways trend.

Technical Indicators
Key supply zones: $20, $25, $30
Key demand zones: $10, $5, $1
What's next for Solana?
Solana will continue to move sideways as long as it fails to break above resistance at $26. Currently, the price is rejected at a high of $26, which will force it to decline. The price indicator predicts that the cryptocurrency will retest its low at $20.

Disclaimer. This analysis and forecast are the personal opinions of the author and are not a recommendation to buy or sell cryptocurrency and should not be viewed as an endorsement by CoinIdol.com. Readers should do their own research before investing in funds.
Price
Price
News
Price
Price

(0 comments)