Bitcoin Price Moves In A Range Above $59,000
Updated: Aug 22, 2024 at 11:54

The price of Bitcoin (BTC) continues to trend sideways, but is now between the moving average lines. Price analysis by Coinidol.com.
Bitcoin price long-term prediction: ranging
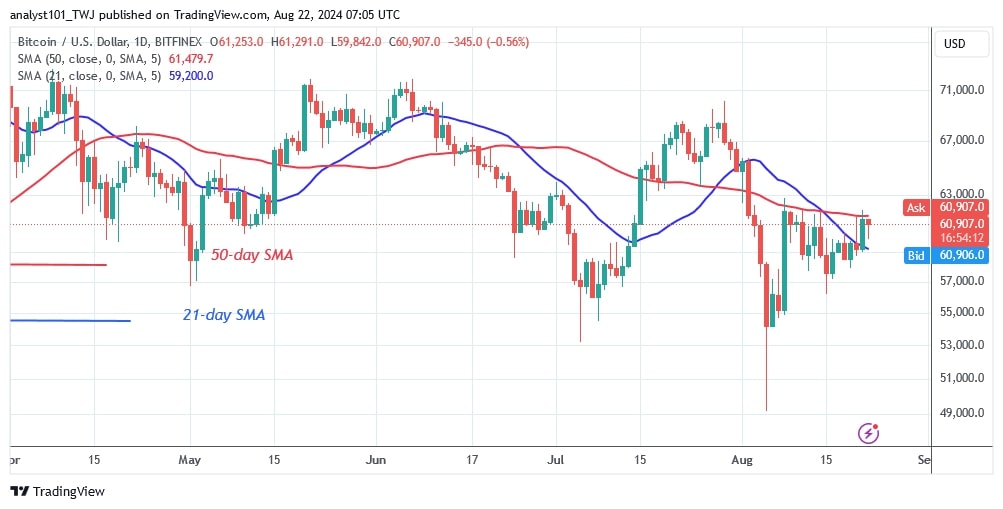
The largest cryptocurrency has been trading below the moving averages but above the $55,000 support over the past two weeks. Buyers have tried three times to keep the price above the moving average lines.
Nevertheless, the BTC price rose above the moving averages on August 21 but was stopped by the 50-day SMA. In other words, Bitcoin is currently trading between the moving average lines. It will resume the uptrend once it rises above the 50-day SMA. Bitcoin price will rise to a high of $65,000. The bullish momentum will extend to the psychological high of $70,000. In contrast, Bitcoin will fall if the 21-day SMA support or $59,000 is breached.
The downside momentum is expected to continue until $55,000. If the current support level is breached, the downtrend will continue to a low of $49,000.
Technical indicators:
Key Resistance Levels – $70,000 and $80,000
Key Support Levels – $50,000 and $40,000
BTC indicator reading
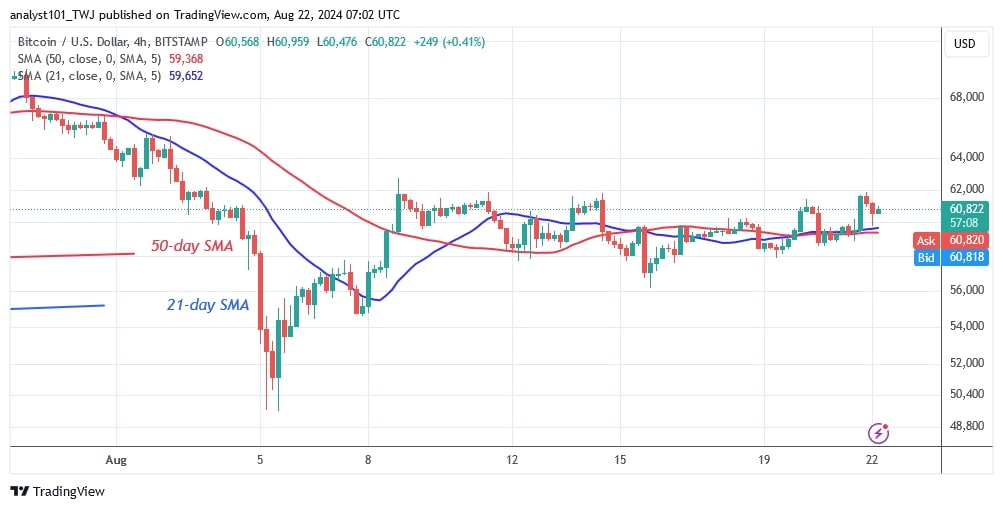
After the price recovery, the BTC price is contained between the moving average lines. On the 4-hour chart, the moving average lines are horizontal, indicating a sideways trend. Bitcoin is moving slightly, with doji candlesticks marking the price trend.

What is the next direction for BTC/USD?
The 4-hour chart shows that Bitcoin is trading in a narrow range between $56,000 and $62,000. Doji candlesticks dominate the price action, indicating traders' indecision on the market direction. Furthermore, Bitcoin is confined between the moving average lines, which means that the cryptocurrency could move within a narrow range.

Coinidol.com analytics predicted last week that Bitcoin can experienced an upward correction but was rejected by the moving average lines.
Disclaimer. This analysis and forecast are the personal opinions of the author. They are not a recommendation to buy or sell cryptocurrency and should not be viewed as an endorsement by CoinIdol.com. Readers should do their research before investing in funds.
News
Price
Price
News
Price

(0 comments)