Solana Encounters Resistance At $22 And Records Another Decline
Updated: Aug 21, 2023 at 10:58

Cryptocurrency analysts of Coinidol.com report, Solana (SOL) is trading below moving average lines after a price decline on August 17.
Solana long-term price forecast: bearish
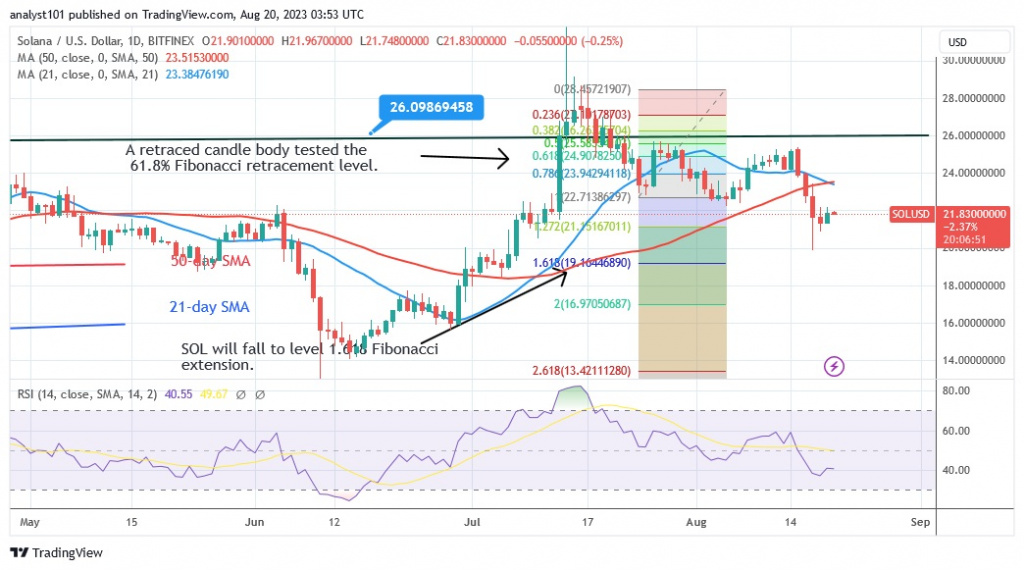
At the time of writing, Solana (SOL) is trading at $21. The price indication suggested that the cryptocurrency would continue to fall. The altcoin had a downward correction to the upside on July 24 and a candlestick tested the 61.8% Fibonacci retracement line.
SOL is expected to fall to the 1.618 Fibonacci extension line or $19.10. Nevertheless, altcoin regained the Fibonacci extension on August 17, when it fell to a low of $19.86. Today, the altcoin is trading above the $19 support.
Solana price indicator analysis
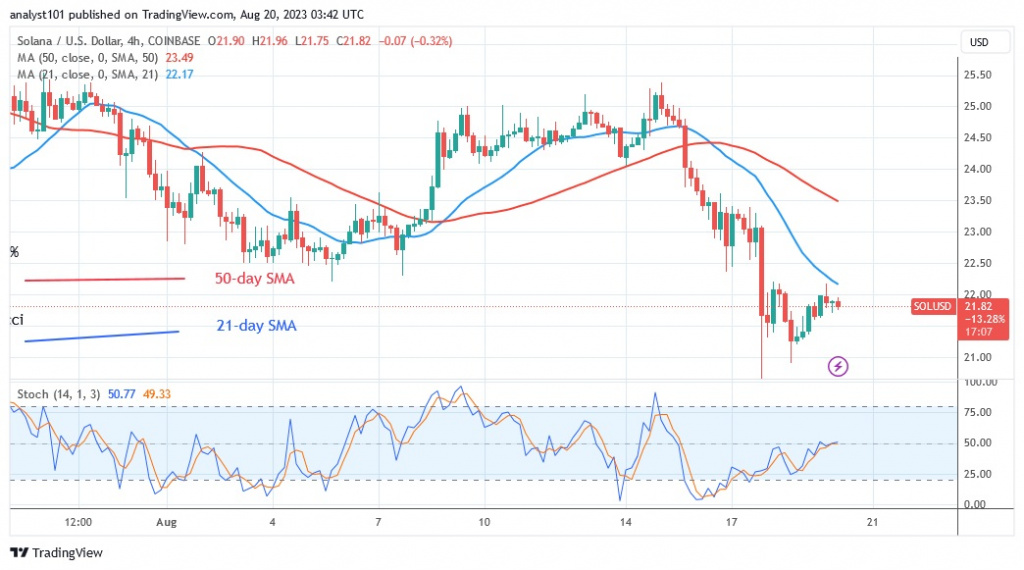
Solana's decline has reached the Relative Strength Index value of 40 for the period 14. The altcoin is in a downtrend and is likely to fall further. The price bars below the moving average line could force the cryptocurrency to fall even more. Solana's bullish momentum has stalled above the daily stochastic level of 50. The altcoin has returned to its previous low of $19.

Technical Indicators
Key supply zones: $20, $25, $30
Key demand zones: $10, $5, $1
What is the next move for Solana?
Solana has continued to fall since the meltdown on August 17. The altcoin reached its bearish limit on August 17 and corrected upward. The upward correction is encountering resistance at the $22 high. If the cryptocurrency value is rejected at the recent high, it will fall or be forced to move within a certain range.

As we reported on August 13, since August 8, the upward momentum has been stopped near the $25 high. If the current resistance is broken, the cryptocurrency asset will rise to a high of $27.
Disclaimer. This analysis and forecast are the personal opinions of the author and are not a recommendation to buy or sell cryptocurrency and should not be viewed as an endorsement by CoinIdol.com. Readers should do their research before investing in funds.
Price
Price
Price
Price
News

(0 comments)