Ethereum Slumps below $500, Faces Strong Rejection at $620 Resistance

Following its impressive bullish run and rally to $620 high, Ethereum faces strong selling pressure from the recent high.
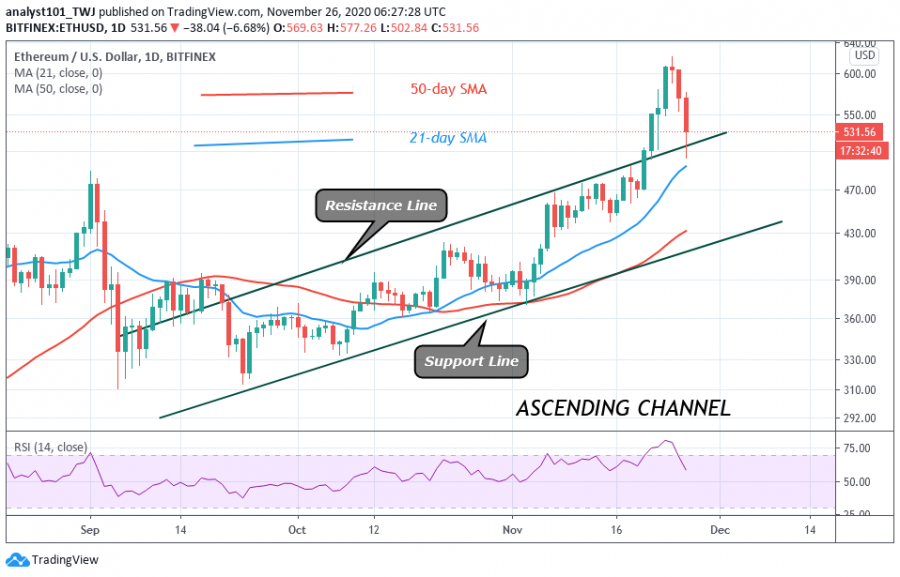
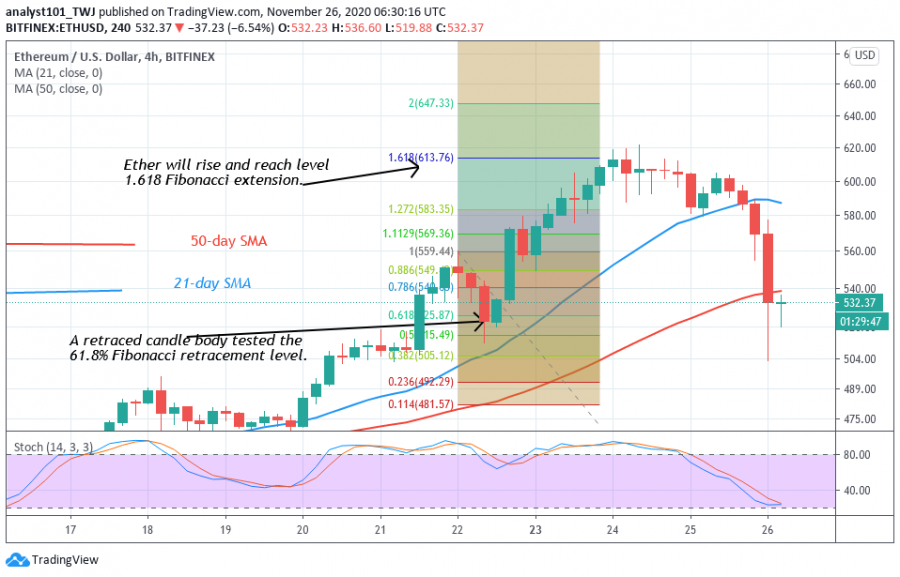
On November 24, the price action indicated candlesticks with long wicks. This explains that there is strong selling pressure at higher price levels. As a result of the rejection, the coin slumped to $580 low. Ether downward move resumes after retesting the $600 high. The biggest altcoin has fallen below $500 at the time of writing. On the 4 –hour chart, the price has broken below the SMAs.
Therefore, there is a likelihood of a further downward movement of the coin. A deeper correction will mean Ether will decline to $469 low. On the other hand, if the current support holds, buyers may want to push the price upward to retest the $620 resistance. The biggest altcoin will resume upside momentum if buyers are successful. The coin will rise to the next resistance at the high of $700 which is the April 2018 price level.
Ethereum indicator analysis
Ethereum price is falling on the downside. If price breaks and closes below the resistance line, the downtrend will continue. The coin has fallen to level 55 of the Relative Strength Index period 14. It indicates that the coin is still on the uptrend zone and above the centerline. ETH has fallen below the 20% range of the daily stochastic. It indicates that the coin is in the oversold region

Key Resistance Zones: $440, $460, $480
Key Support Zones: $160, $140, $120
What is the next direction for Ethereum?
The biggest altcoin is on a downward move after its inability to break above the $620 high.ETH has fallen to $500 low and pulled back. The coin will further decline to $469 if the $500 support cracks. On the daily chart, the coin is falling and approaching the 21-day SMA support. The crypto will resume an upward move if it finds support above 21-day SMA.

Disclaimer. This analysis and forecast are the personal opinions of the author that are not a recommendation to buy or sell cryptocurrency and should not be viewed as an endorsement by CoinIdol. Readers should do their research before investing funds.
Coin expert
Price
News
Coin expert
Price

(0 comments)