Binance Coin Continues Sideways Movement Below $665
Updated: Jul 10, 2025 at 12:10

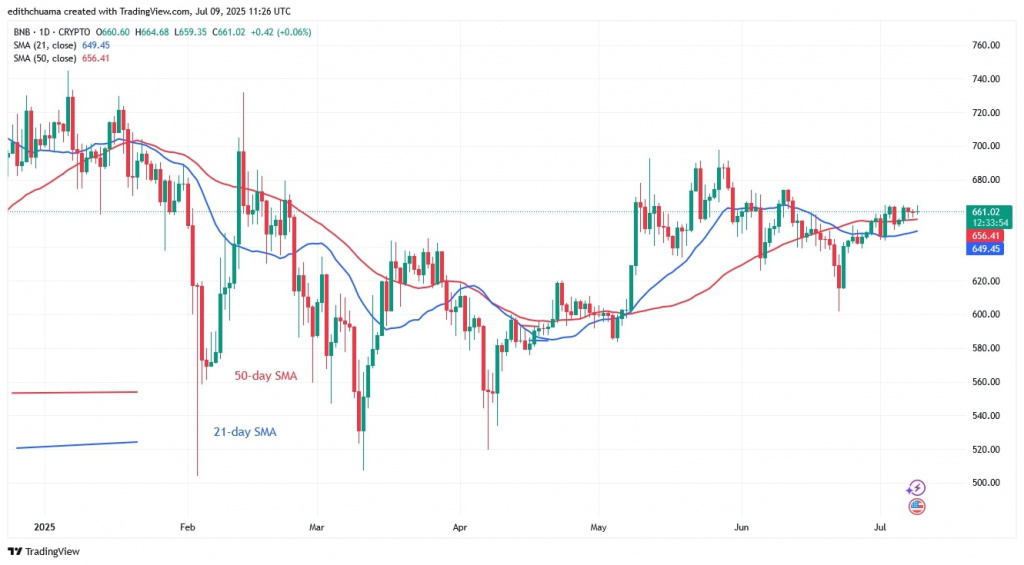
The price of Binance Coin (BNB) continued its upward trend on July 5 and rose above the moving average lines.
BNB price long-term prediction: bullish
The bears had already broken below the moving averages twice, but the bulls bought the dips.
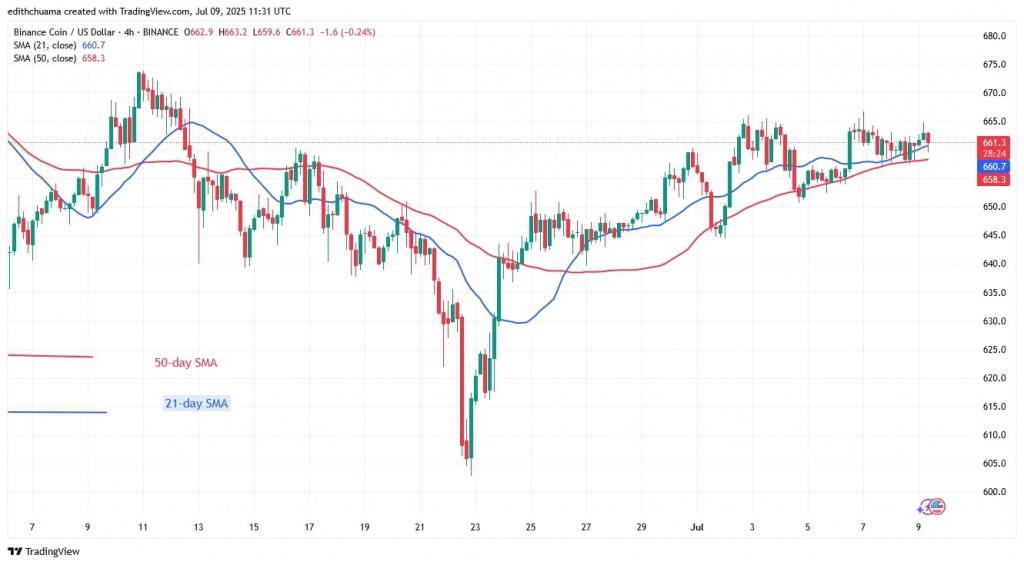
Since July 2, the uptrend has paused at a high of $665. BNB is trading within a narrow range above the 50-day SMA and below the $665 resistance level.
The price of the altcoin could fall below the moving average or rise above the $665 level. A rally will propel the altcoin to a new high of $674. The uptrend will continue to a high of $690. The altcoin could drop to as low as $640 if it falls below the 50-day SMA. In the meantime, the value of BNB stands at $662.
BNB indicators analysis
BNB has been trading above the moving average lines since the 2nd of July. BNB continues to move sideways due to resistance at $674. The dominance of doji candlesticks has contributed to the ongoing sideways trend.
Technical indicators:
Key Resistance Levels – $600, $650, $700
Key Support Levels – $400, $350, $300

What is the next direction for BNB/USD?
BNB has risen to the initial hurdle of $665. The altcoin is trading in a limited range above the moving averages and below the $665 barrier. BNB's next move is unpredictable due to the existence of doji candles. The candlesticks have caused the price to remain stationary.

Coinidol.com reported that BNB has reached its opening high of $663 and the positive momentum is expected to continue to the high of $675 on July 4.
Disclaimer. This analysis and forecast are the personal opinions of the author. They are not a recommendation to buy or sell cryptocurrency and should not be viewed as an endorsement by CoinIdol.com. Readers should do their research before investing in funds.
Price
Price
News
News
Price

(0 comments)