Coinidol.com: Ethereum Battles and Maintains Its Range Above $2,200
Ethereum’s price has risen above its lower range but remains confined between the moving average lines.
Ethereum Price Long-Term Analysis: Ranging
The largest altcoin continues to trade within a range between the $2,200 support level and the $2,500 high. Currently, price movement is restricted by the 50-day SMA as support and the 21-day SMA as resistance.
On the downside, if Ether loses support at the 50-day SMA, it could fall to lows of $2,200 and $2,000. Alternatively, if buyers push the price above the 21-day SMA, Ether may rise to $2,400 and $2,500. Once buyers overcome the $2,500 barrier, the largest altcoin is expected to gain momentum, potentially reaching the next high of $3,000. Today, Ether is at $2,268.
Technical indicators:
-
Resistance Levels: $4,500 and $5,000
-
Support levels: $3,000 and $2,500
Ethereum Indicator Analysis
The largest altcoin is currently trapped between the 50-day SMA support and the 21-day SMA resistance. This suggests that Ether will likely remain between the moving average lines for several days. Ether’s price bars are below the horizontal moving average lines. The long candlestick wicks are being rejected at the moving average lines, indicating strong selling pressure at recent peaks.
 - May 14, 2026")
What Is the Next Direction for Ethereum?
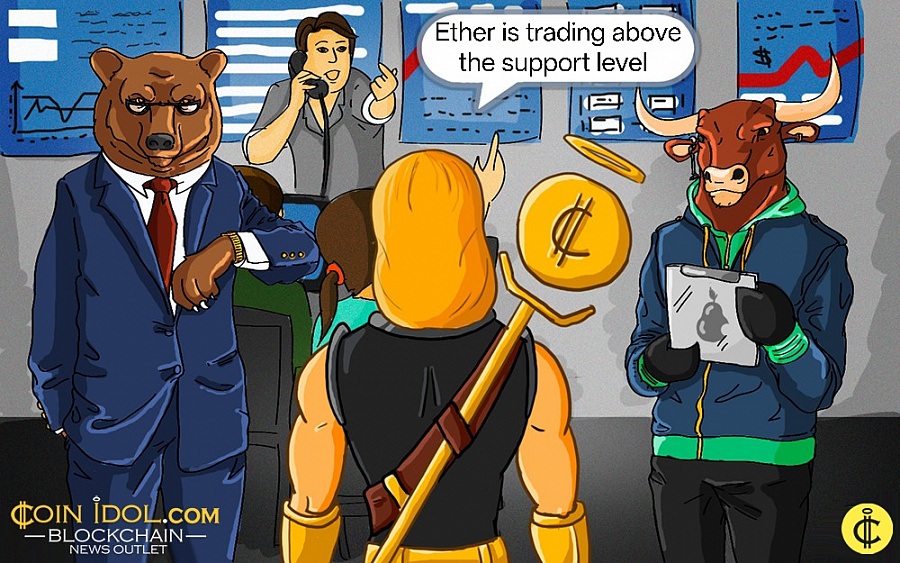
Ethereum has declined and found support above the $2,240 level for the third time since April 19. Today, Ether is trading above the $2,240 support level but remains below the moving average lines. The price is rising, but it has stalled below the $2,280 high.
Since April 19, buyers have been defending the $2,200 level. However, the largest cryptocurrency will trend only if buyers push the price above the moving average lines or fail to defend the $2,200 support.
 -May 14, 2026")
Disclaimer. This analysis and forecast are the personal opinions of the author. The data provided is collected by the author and is not sponsored by any company or token developer. This is not a recommendation to buy or sell cryptocurrency and should not be viewed as an endorsement by Coinidol.com. Readers should do their research before investing in funds.
Price
News
News
News
News

(0 comments)