Binance Coin Encounters Resistance At Its Recent High Price
Updated: Dec 07, 2023 at 14:40

Binance (BNB) coin price is in a downtrend zone, although the altcoin is climbing back to its previous highs. Price analysis by Coinidol.com.
Binance coin price long-term prediction: bearish
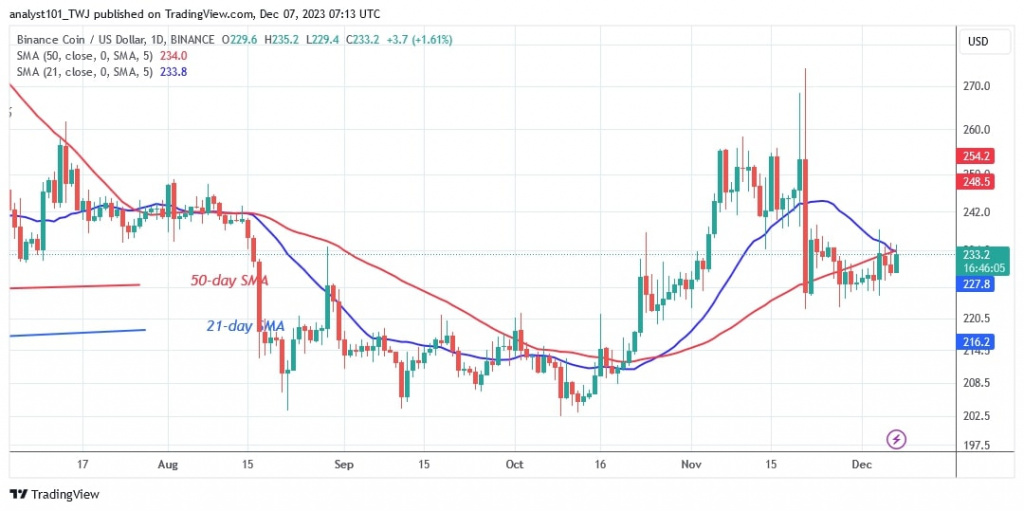
The 50-day SMA and resistance at $235 have rejected the positive momentum on Dec. 4 and Dec. 7. The moving average lines are restricting the upward movement. At the top, BNB is facing a sharp rejection.
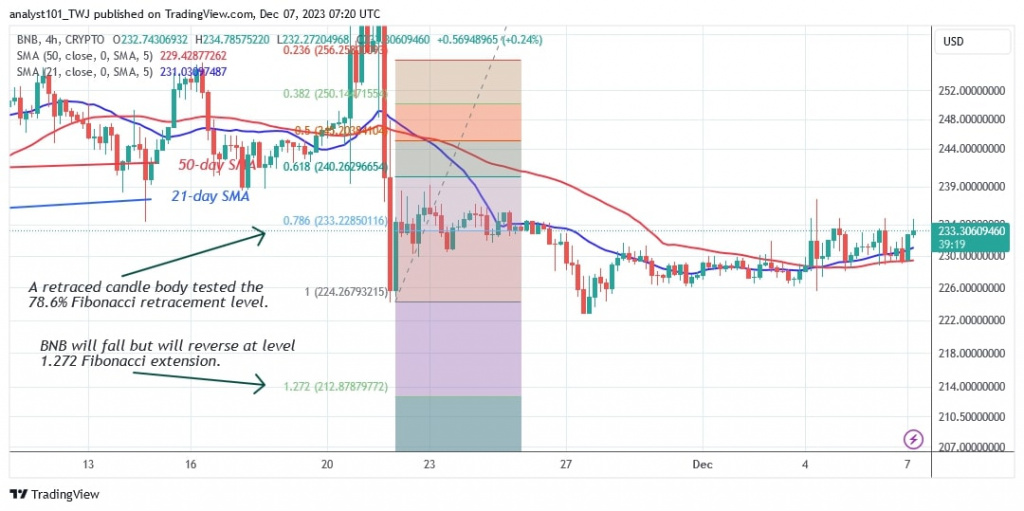
Since November 21, the price of the cryptocurrency has been trapped in a range of $223 and $235. The altcoin will fall back to its previous low of $203 if the bears break below the current support line at $223. On December 1, Coinidol.com reported that BNB was trading between $223 and $234 per coin. Now, the horizontal trend is expected to continue if the current support and resistance levels are maintained.
BNB indicator reading
Since November 21, the moving average lines have been falling horizontally due to the sideways trend. Currently, the moving average lines are below the price bars. Doji candlesticks are a sign that the price movement is lagging.
Technical indicators:
Key resistance levels – $300, $350, $400
Key support levels – $200, $150, $100

What is the next direction for BNB/USD?
BNB/USD will continue to trade sideways as the altcoin encounters resistance at the moving average lines. The bears are defending the moving average lines as the cryptocurrency falls from its previous high. The cryptocurrency is currently trading in a narrow range between $226 and $235.

Disclaimer. This analysis and forecast are the personal opinions of the author and are not a recommendation to buy or sell cryptocurrency and should not be viewed as an endorsement by CoinIdol.com. Readers should do the research before investing in funds.
News
Coin expert
Price
Price
News

(0 comments)