Weekly Cryptocurrency Market Analysis: Altcoins Lose Ground As Cryptocurrencies Struggle To Hold Current Support Levels

Weekly cryptocurrency analysis of dYdX, Bone ShibaSwap, Toncoin, Bitcoin Cash and Mantle brought to you by Coinidol.com.
Bitcoin and the altcoins have been under selling pressure since the recent drop on August 17. The best performing altcoins are not immune to the current bear market.
dYdX
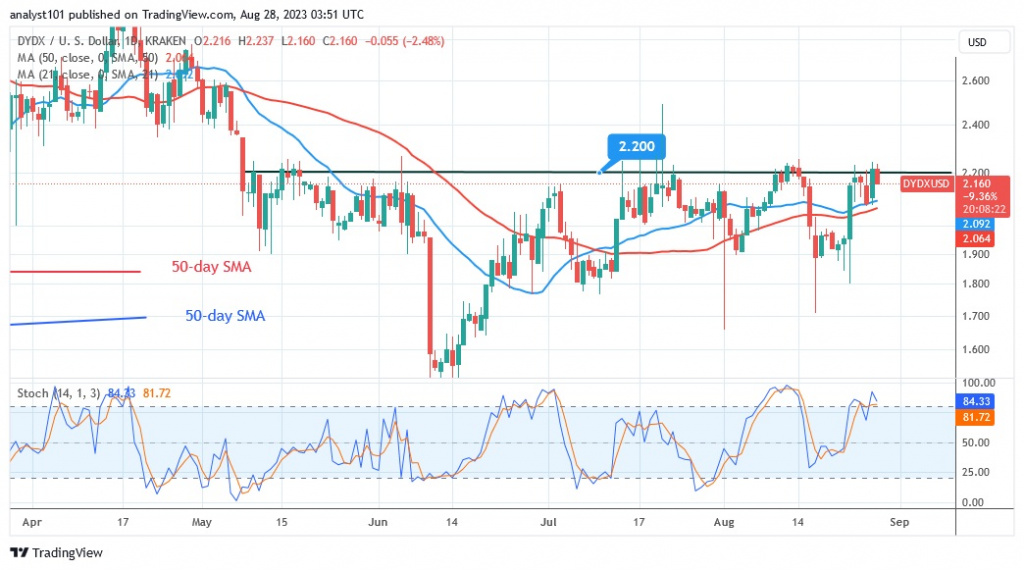
dYdX (DYDX) is down, but has recovered from the recent downtrend. The cryptocurrency's price fell to a low of $1.37 as the bulls bought the dips. Since July 1, the altcoin has been at its all-time high of $2.20. DYDX is currently trading above the moving average lines but below the resistance line. If the current resistance is broken, the cryptocurrency asset will rise to a high of $2.80 or $3.00. The altcoin is currently trading in the overbought zone of the market. However, if the altcoin fails at its recent high, it could fall. The decline could reach a low of $1.80. DYDX has positive momentum above the daily stochastic threshold of 80. The best performing cryptocurrency is DYDX, which has the following characteristics:
Current price: $2.17
Market capitalization: $2,171,548,450
Trading volume: $68,008,397
7–day gain/loss: 13.06%
Bone ShibaSwap
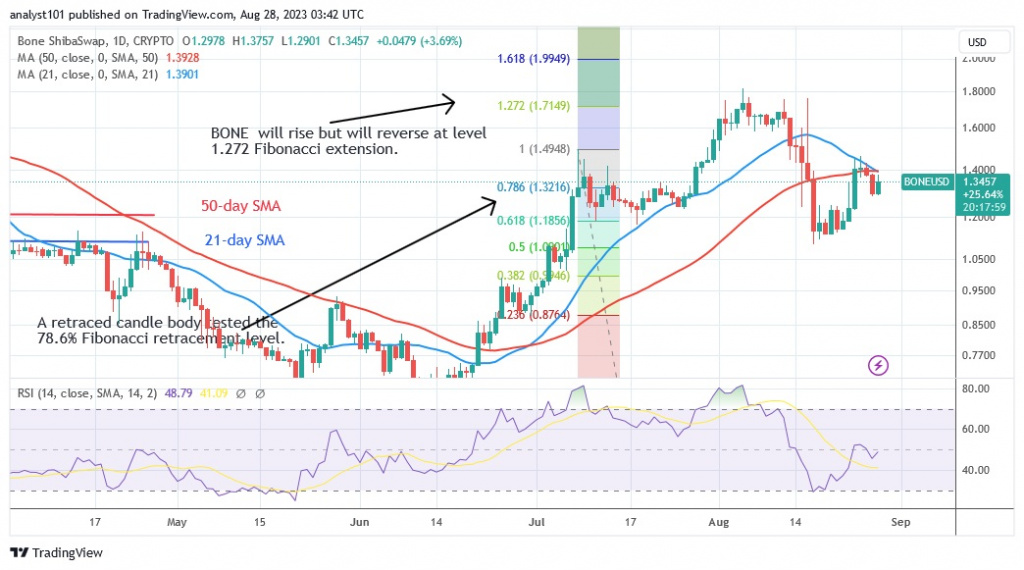
Bone ShibaSwap (BONE) is in a downtrend after completing the uptrend. The price of the altcoin has fallen below the moving average lines. The cryptocurrency fell to a low of $1.15 before resuming consolidation above the current support. Buyers are trying to push the altcoin back to the previous high but are facing resistance at the moving average lines. After the rejection, the altcoin falls back to the existing support. If the current support holds, BONE will resume its sideways movement. The price of BONE will fluctuate between $1.05 and $1.40. However, if the current support is broken, the value of the altcoin will fall. For the period 14, the altcoin is in a negative trend at the 47 level of the Relative Strength Index. BONE is the second most valuable cryptocurrency and has the following characteristics:
Current price: $1.35
Market capitalization: $330,274,532
Trading volume: $11,337,
7–day gain/loss: 10.43%
Toncoin
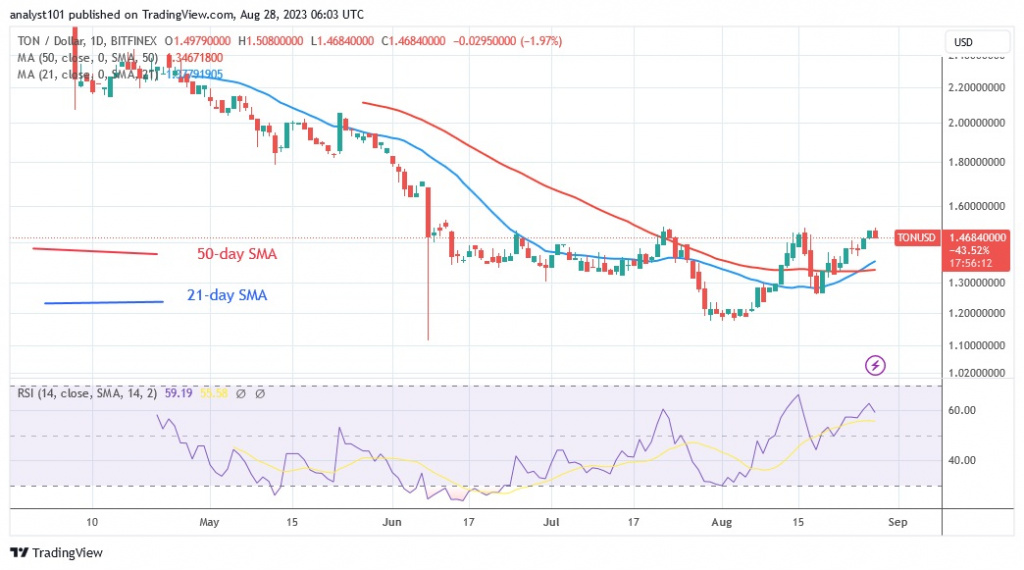
Toncoin (TON) is in an uptrend but is stuck above the $1.50 high. Since July 22, buyers have tried three times to break above the $1.50 resistance level but have failed. TON will fall below the moving average lines each time the currency is pushed back. If the current resistance level is broken, TON will rise to a high of $2.00. On the other hand, the altcoin will continue its movement between $1.15 and $1.50, where the existing resistance remains unbroken. At the time of writing, TON was trading at $1.46. For the period 14, the altcoin is in the positive trend zone, with a Relative Strength Index of 59. It is the third best performing cryptocurrency and has the following characteristics:
Current price: $1.47
Market capitalization: $7,430,355,548
Trading volume: $26,558,482
7–day gain/loss: 8.81%
Bitcoin Cash
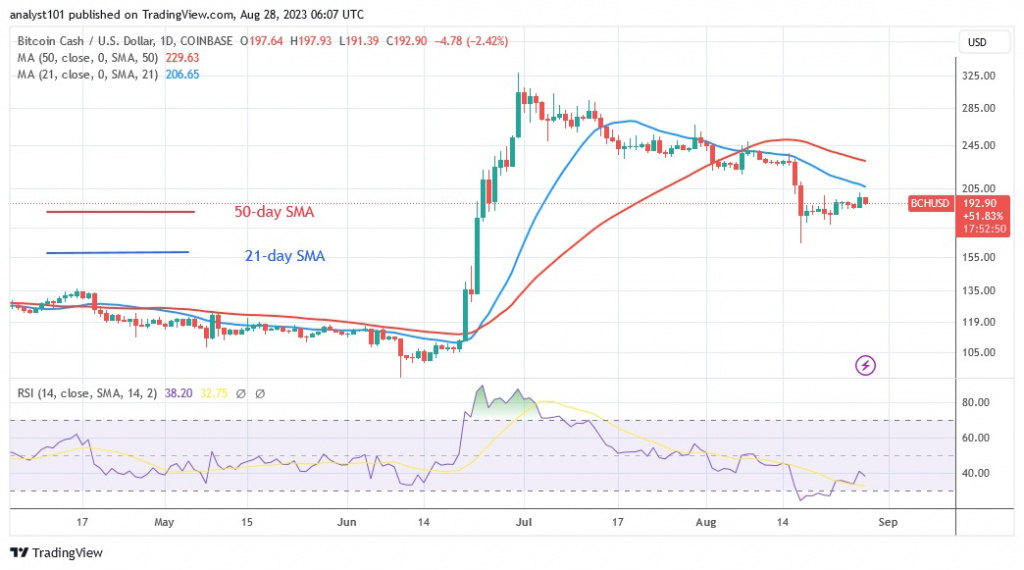
The price of Bitcoin Cash (BCH) is falling below the moving average lines. BCH had risen to a high of $325 before exhausting itself to the upside. The uptrend was broken when the market entered the overbought zone. The altcoin fell below the moving average lines and reached a low of $164. BCH slipped into the oversold area of the market. While the altcoin corrects upwards, the bulls bought the dips. The upward correction meets resistance at the high of $205 or the 21-day line SMA. If the current resistance level is broken, the altcoin will resume its uptrend. The cryptocurrency is correcting upwards while exceeding the Relative Strength Index value 38 for the period 14. It is the fourth most profitable cryptocurrency. Some of the characteristics are as follows:
Current price: $193.11
Market capitalization: $4,049,490,314
Trading volume: $157,924,196
7–day gain/loss: 3.39%
Mantle
Mantle (MNT) is in a downtrend, but recently bounced back above the $0.41 support level. As the altcoin rose above the moving average lines, the bulls bought the dips. The altcoin reached a high of $0.44 before being pushed back. Altcoin has risen above the moving average lines as a result of the rejection. The uptrend will continue if the altcoin stays above the moving average lines. This will allow the cryptocurrency price to retest the current resistance level and resume its uptrend. If the price falls below the moving average lines, the altcoin will come under selling pressure again. MNT will fall and retest its previous low. At the time of writing, the altcoin is trading at $0.43. For period 14, the altcoin is in the bullish trend zone at level 50 of the Relative Strength Index. This means that the price of the Altcoin has reached equilibrium as supply and demand balance each other out. The altcoin is the fifth best-performing cryptocurrency and has the following characteristics:
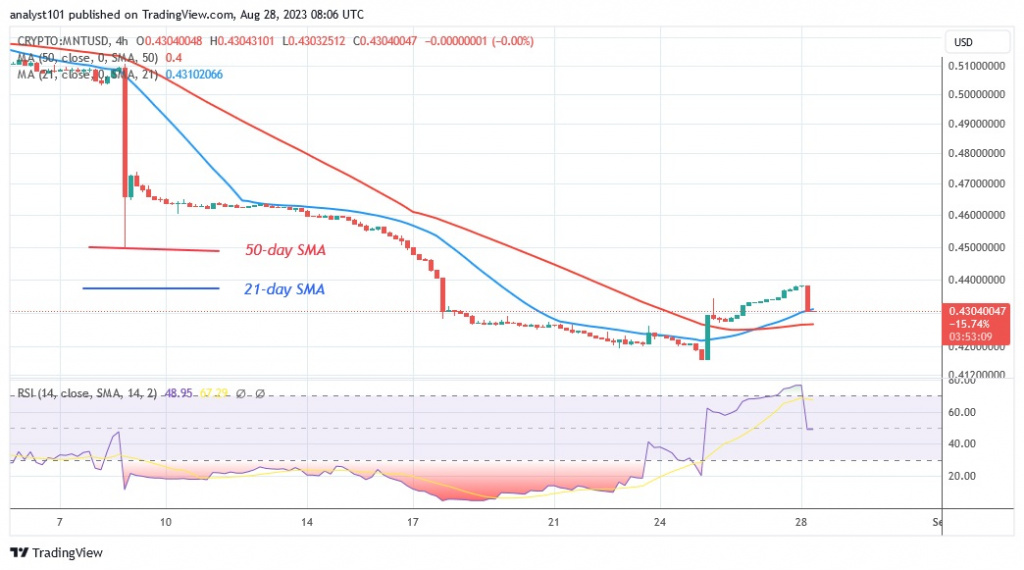
Current price: $0.43
Market capitalization: $2,684,075,346
Trading volume: $5,921,938
7–day gain/loss: 3.24
Disclaimer. This analysis and forecast are the personal opinions of the author and are not a recommendation to buy or sell cryptocurrency and should not be viewed as an endorsement by CoinIdol.com. Readers should do their research before investing in funds.
Price
Price
Coin expert
Coin expert

(0 comments)