Uniswap Faces Rejection Twice at Previous Highs as It Revisits the $4.62 Low

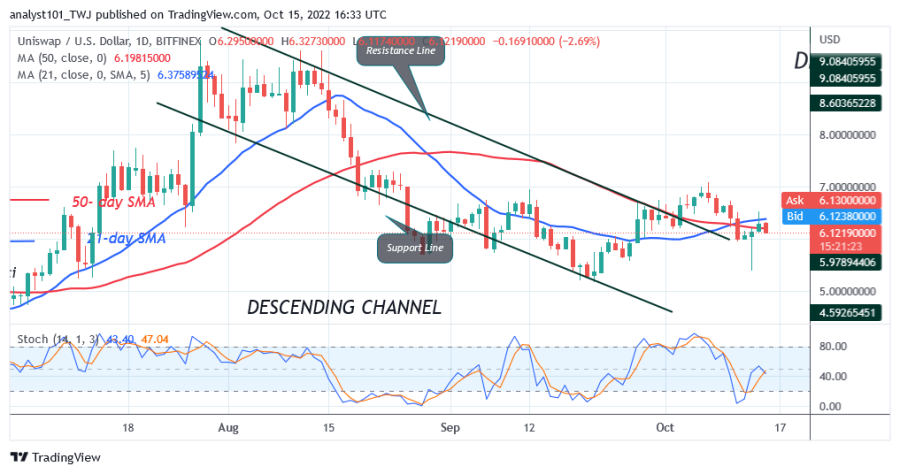
Uniswap (UNI) is in a downtrend as the price falls below the moving average lines. On October 7, the upward correction failed as buyers were rejected at the high of $7.00.
UNI dropped below the moving average lines but retested a low of $6.50. The second retest of the recent high confirms selling pressure. It is likely that the altcoin will fall back to the previous low of $4.62. A long candlestick is seen on October 13, indicating the previous low at $5.50. The long candle tail indicates that there is strong buying pressure at the lower price levels.
Uniswap indicator analysis
The cryptocurrency is likely to continue falling as the price bars are below the moving average lines. The 21-day line SMA and the 50-day line SMA are sloping south, indicating a downtrend. Meanwhile, the altcoin is in a bearish momentum below the 40% area of the daily stochastic.

Technical indicators
Key Resistance Zones: $12.00, $14.00, $16.00
Key Support Zones: $10.00, $8.00, $6.00
What is the next direction for Uniswap?
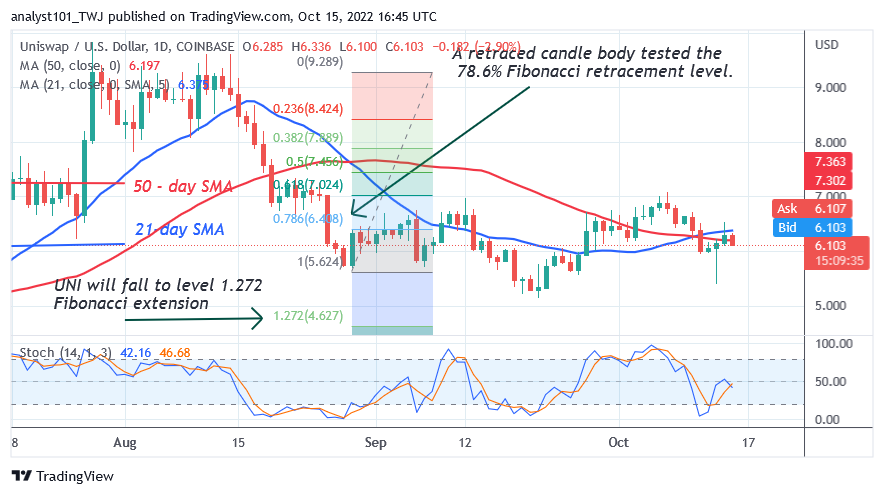
Uniswap will likely continue to decline as it has been rejected twice at the $7.00 and $6.50 price levels. During the downtrend on August 29, UNI took an upward correction and a candlestick tested the 78.6% Fibonacci retracement level. The correction means that the altcoin will fall to the level of the 1.272 Fibonacci extension or the $4.62 price level. The movement shows that UNI has fallen to a low of $6.06 at the time of writing.

Disclaimer. This analysis and forecast are the personal opinions of the author and are not a recommendation to buy or sell cryptocurrency and should not be viewed as an endorsement by CoinIdol. Readers should do their research before investing in funds.
Price
Price
Price
Price
Price

(0 comments)