Toncoin Loses Value While Maintaining Its Horizontal Trend
Updated: Jul 20, 2024 at 16:41

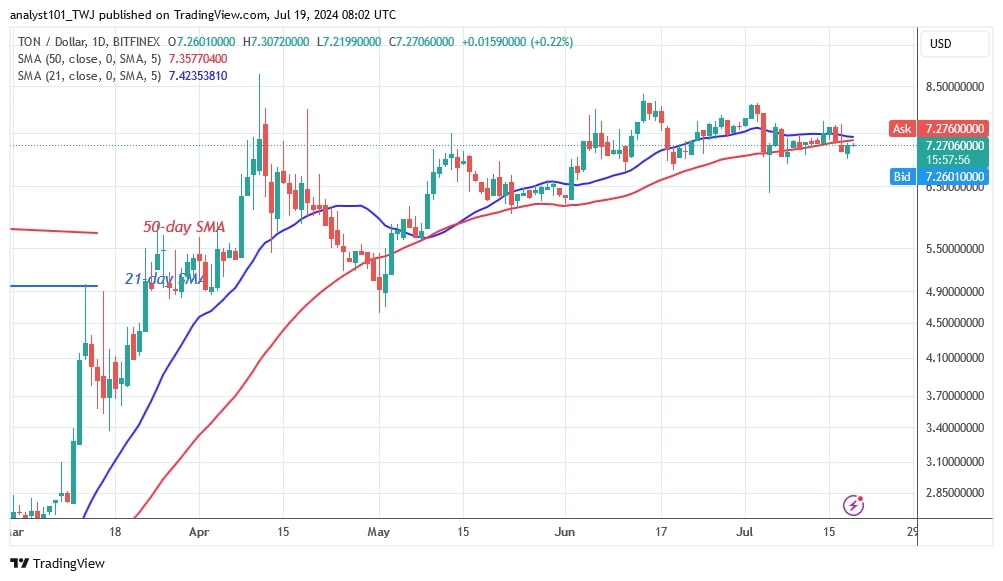
The Toncoin (TON) price has slipped below the moving average lines in a sideways trend. Since April 12, the cryptocurrency has traded between $6.50 and $8.50.
Toncoin price long term forecast: ranging
The cryptocurrency has shown no trend due to the dominance of doji candlesticks. On July 17, the bears broke below the moving averages and forced the cryptocurrency to fall. TON is expected to fall to its previous low of $6.50 or $5.50. TON will resume its uptrend once it rises above the moving average lines and the $8.50 mark.
Toncoin indicator analysis
The price bars are falling below the horizontal moving average lines. The price movement consists of small, uncertain candles, the so-called dojis. The price movement is determined by the candlesticks as traders are undecided about the direction of the market.
Technical Indicators
Resistance Levels: $6.00, $8.00, $10.00
Support Levels: $5.00, $3.00, $1.00

What is the next move for Toncoin?
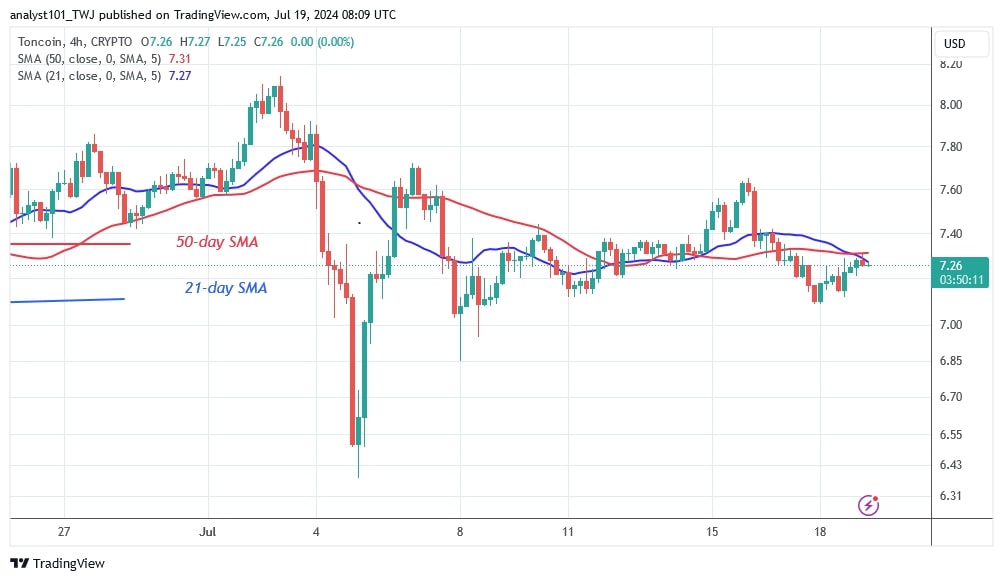
On the 4-hour chart, TON is in a horizontal trend and fluctuates within a small range. The price of the altcoin is fluctuating between $7.00 and $7.60. Currently, the upward correction is rejected at the moving average lines. This indicates that the coin could depreciate.

Disclaimer. This analysis and forecast are the personal opinions of the author and are not a recommendation to buy or sell cryptocurrency and should not be viewed as an endorsement by CoinIdol.com. Readers should do their research before investing in funds.
News
Price
Price
News
Coin expert

(0 comments)