TRON Continues Its Upward Trend And Stays Above $0.134

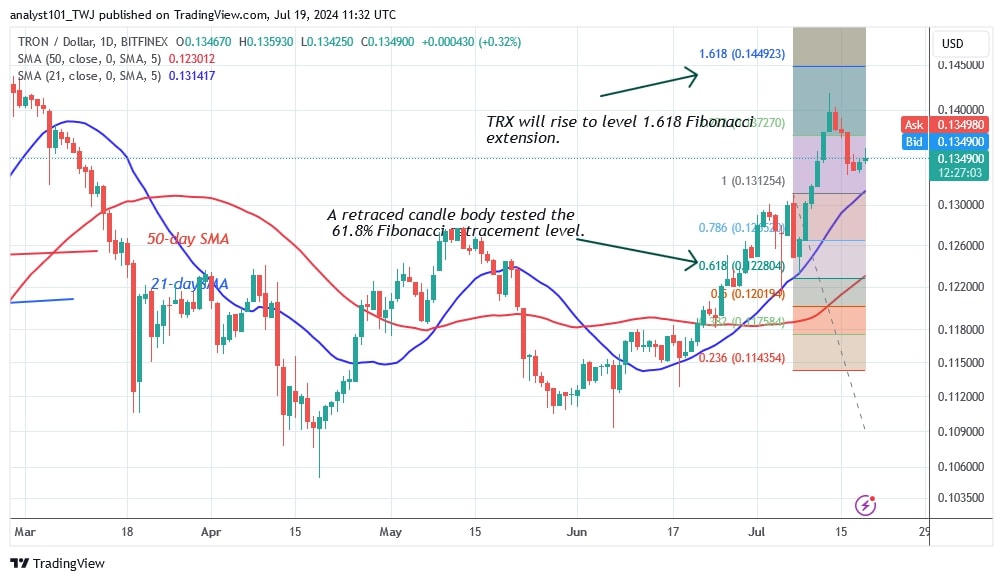
TRON (TRX) is in a slight retracement above the 21-day SMA support after hitting a high of $0.14 earlier.
Long-term outlook for TRON price: bullish
TRON reached a high of $0.144 on February 27 but failed to sustain its positive trend, with buyers pushing the altcoin to the same price level but failing to break the previous high.
TRON has resumed its uptrend after retracing above the moving average lines. The uptrend will continue if the 21-day SMA support holds. If the bulls break through the $0.144 resistance, the market will reach a high of $0.16. If the 21-day SMA support is broken, TRON will fall and resume its sideways trend between $0.11 and $0.14. TRX/USD is currently trading at $0.134.
TRON indicator reading
TRON has been trading in a positive trend zone since June 9, as reported by Coinidol.com, with the price bars above the moving average lines. The positive momentum will continue as long as the price bars are above the moving average lines. The current uptrend could come to an end if the 21-day SMA support is breached.

What is TRON's next move?
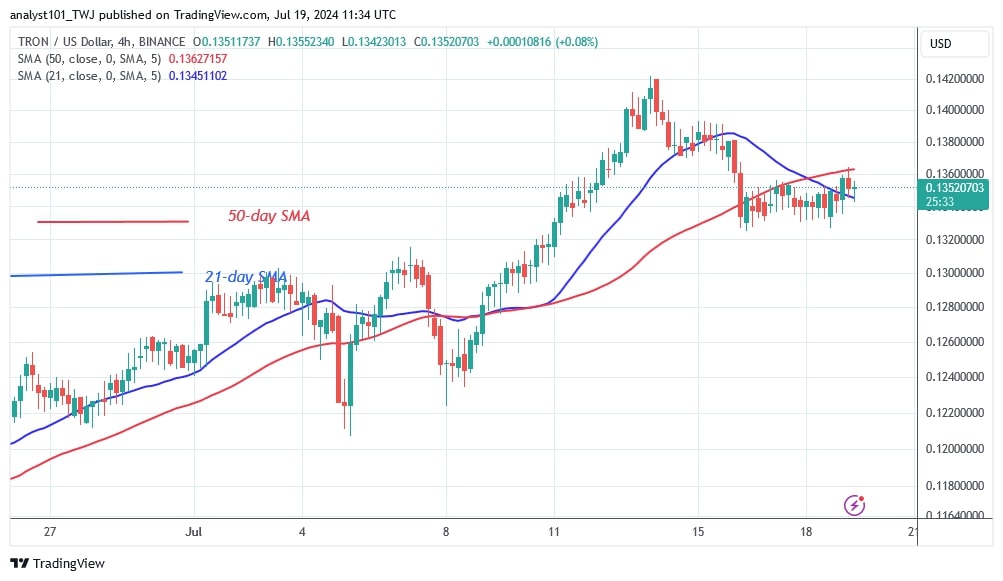
On the 4-hour chart, TRON is bearish below the moving average lines. The decline has slowed above the $0.134 support. Currently, the price of the cryptocurrency is between the moving average lines. TRON will resume its uptrend once it breaks above the 50-day SMA.

Disclaimer. This analysis and forecast are the personal opinions of the author and are not a recommendation to buy or sell cryptocurrency and should not be viewed as an endorsement by CoinIdol.com. Readers should do their research before investing in funds.
Price
Politics
Price
Price
Price

(0 comments)