Cardano Pauses Below $0.46 And Continues Its Ascent

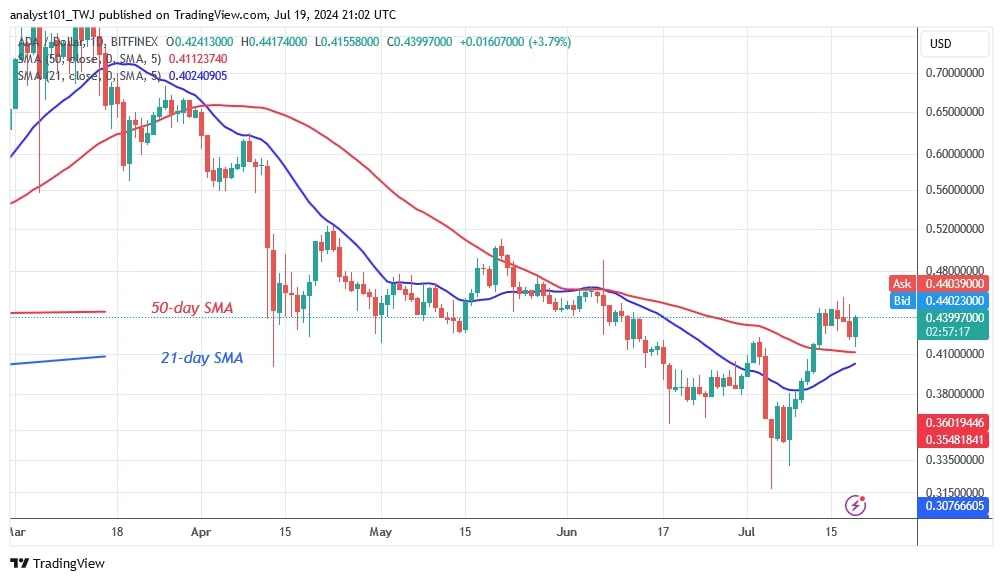
The price of Cardano (ADA) continued its upward trend after the rally on July 13. The altcoin rose to a high of $0.4568 but paused there. ADA price analysis by Coinidol.com.
Long-term forecast for the Cardano price: bullish
Buyers were unable to sustain the positive momentum above the $0.46 resistance zone. The cryptocurrency is trading above the moving averages but below the $0.46 high. If the current resistance level is broken, the cryptocurrency will return to its high of $0.52.
However, Cardano risks a decline if the bears break below the moving average lines. The altcoin continues to trade between $0.32 and $0.46. Meanwhile, the ADA price is currently at $0.44.
Analysis of the Cardano indicators
Since July 13, the price bars have crossed above the moving average lines. This indicates that the positive trend is continuing and that the ADA price could rise. The price movement is characterized by small, indecisive candlesticks that dominate the price action.
Technical Indicators
Key Resistance Zones: $0.80, $0.85, and $0.90
Key Support Zones: $0.50, $0.45, and $0.40

What is the next move for Cardano?
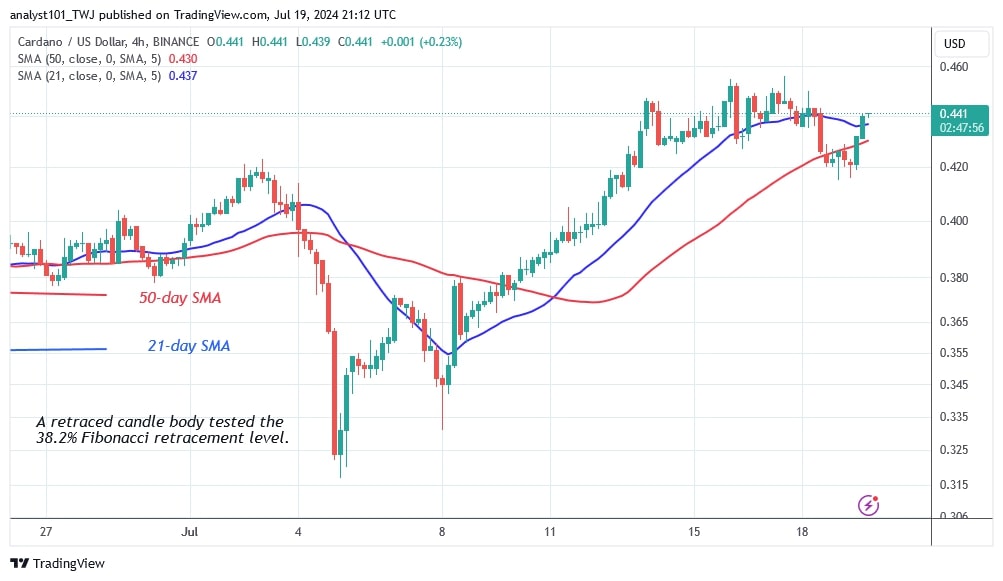
On the 4-hour chart, Cardano is in a sideways trend after the trend was stopped at $0.46. Since July 13, the bullish momentum has paused at the current high, with the altcoin fluctuating above the moving average lines. The uptrend is uncertain due to the doji candlesticks delaying the price movement.

After the rise on July 1, the price of the cryptocurrency was caught between the moving average lines. However, the uptrend was short-lived as it encountered resistance at the 50-day moving average line, as reported by Coinidol.com previously.
Disclaimer. This analysis and forecast are the personal opinions of the author and are not a recommendation to buy or sell cryptocurrency and should not be viewed as an endorsement by CoinIdol.com. Readers should do their research before investing in funds.
Price
News
Price
Price
Price

(0 comments)