TRON Remains Stable Above $0.244

The price of TRON (TRX) has remained in a horizontal trend above the moving average lines.
TRON price long-term forecast: ranging
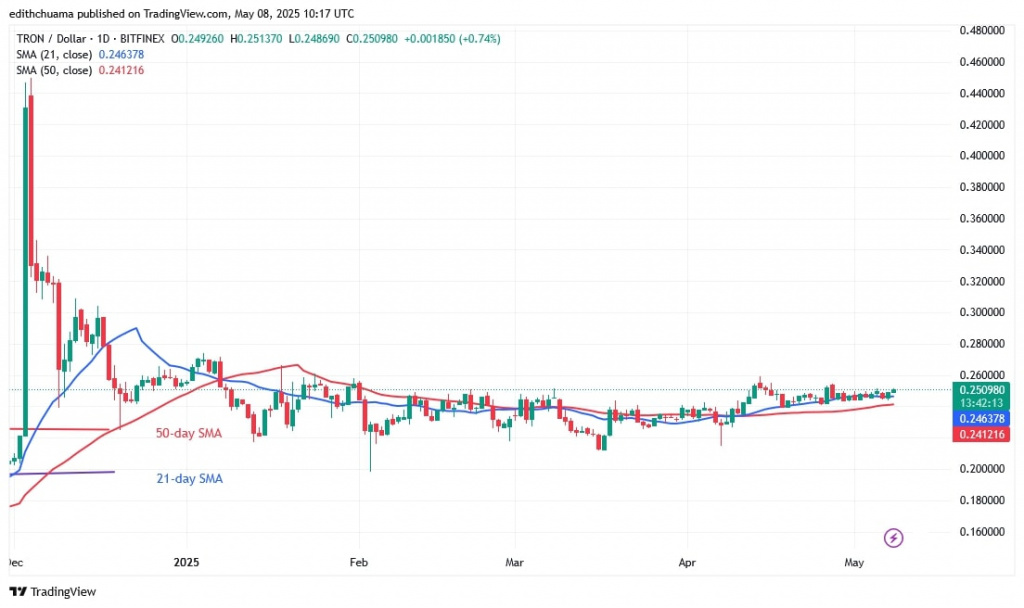
The price of the cryptocurrency is below the $0.255 level and just above the 21-day SMA.
Since April 14, the price movement has been limited to a small range. The upward trend was halted below the high of $0.255. Similarly, selling pressure has stopped above the 21-day SMA support since April 18, as reported by Coinidol.com.
TRON will fall if it loses the 21-day SMA support, but it will first drop to $0.24 before falling to $0.225. Although TRON is facing resistance at $0.255, the price is rising today.
TRX indicator analysis
TRON is trading in a positive trend when the price bars are above the moving average lines. Due to the doji candlesticks, the price is stagnating within a narrow range. The sideways trend is indicated by the moving average lines lying on a straight line.
Technical Indicators
Key Resistance Zones: $0.40, $0.45, and $0.50
Key Support Zones: $0.20, $0.15, and $0.10

What is the next move for TRON?
TRON's horizontal trend has kept the price stable. Due to the indecision of traders regarding the market direction, the cryptocurrency value is moving within a narrow range.
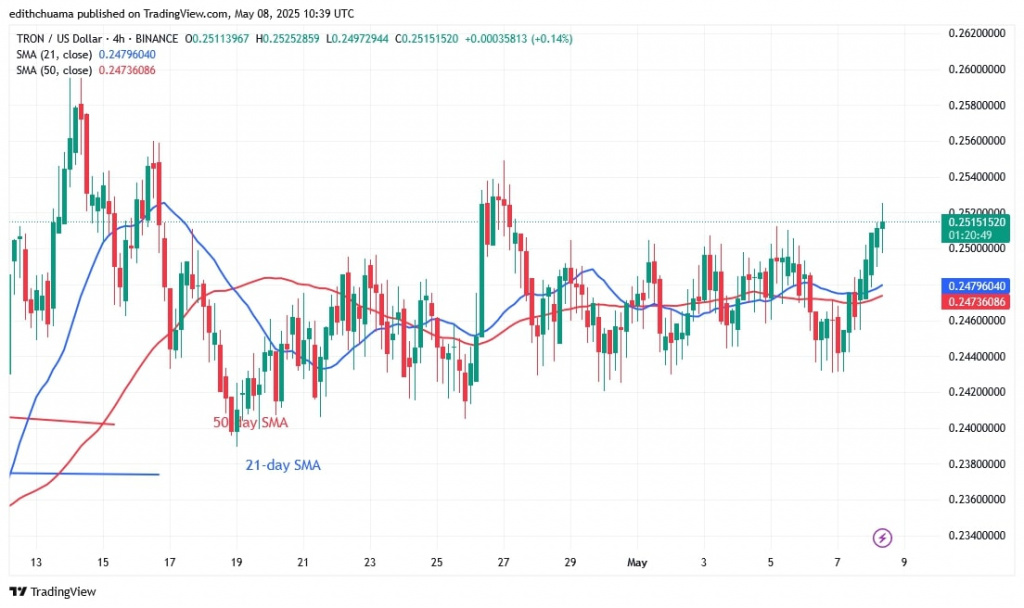
On the 4-hour chart, the price of TRON is fluctuating below the resistance at $0.255 but is stable above the support at $0.244. Since April 14, the present barrier has remained unbroken.

Disclaimer. This analysis and forecast are the personal opinions of the author. They are not a recommendation to buy or sell cryptocurrency and should not be viewed as an endorsement by CoinIdol.com. Readers should do their research before investing in funds.
Price
Price
Price
Price
Price

(0 comments)