TRON Loses Ground And Fears A Further Decline
Updated: Mar 15, 2024 at 19:46

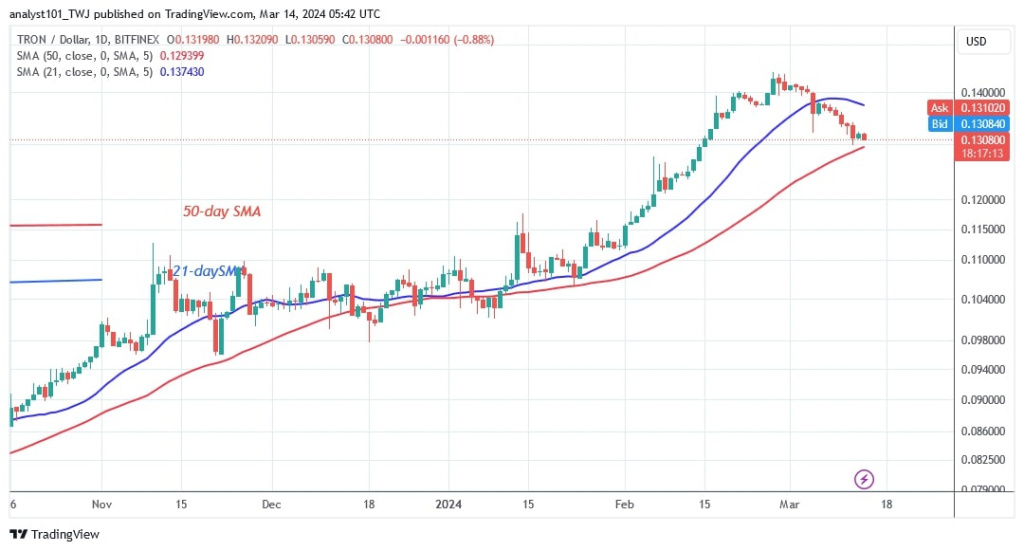
The price of TRON (TRX) has slipped below the moving average lines but remains above the 50-day SMA or support at $0.129.
Long-term forecast for the TRON price: bearish
The cryptocurrency is currently above the 50-day SMA but below the 21-day SMA. In other words, TRON is stuck between the moving average lines. The altcoin will fall if the bears break the support of the 50-day SMA. The cryptocurrency will continue to fall and reach a low above $0.12. On the other hand, if the 50-day SMA support holds, TRON would move between the moving average lines for several days.
If the bulls break the 21-day SMA, the altcoin will regain its upside momentum. The cryptocurrency will grow and test its recent high of $0.144. TRX/USD is currently worth $0.13.
TRON indicator reading
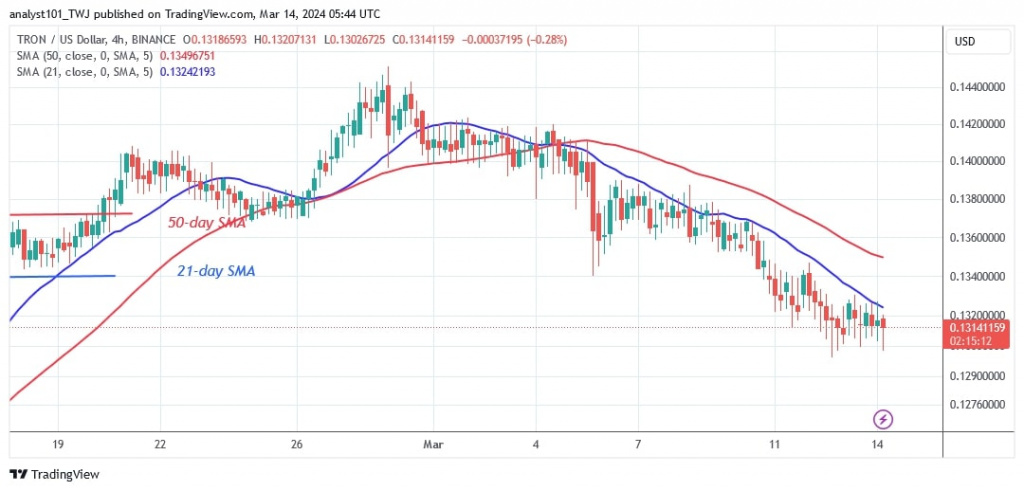
After the recent downturn, the price bars have shifted between the moving average lines. The bears are aiming to break the 50-day SMA. Should the bears succeed, the altcoin will fall much further. On the 4-hour chart, the moving average lines are sloping downwards, indicating a downtrend.
Technical indicators
Important supply zones: $0.09, $0.10, $0.11
Important demand zones: $0.06, $0.05, $0.04

What is the next direction for TRON?
TRON is bearish after reaching resistance at $0.144. Since February 29, the cryptocurrency has fallen between the moving average lines. If the current support holds, the cryptocurrency will start to move in a range. The altcoin will fluctuate between $0.13 and $0.14 price levels.

Disclaimer. This analysis and forecast are the personal opinions of the author and are not a recommendation to buy or sell cryptocurrency and should not be viewed as an endorsement by CoinIdol.com. Readers should do their research before investing in funds.
Price
Price
Price
Price
News

(0 comments)