TRON Keeps Getting Better And Higher, Reaching A High Of $0.126
Updated: May 11, 2024 at 15:27

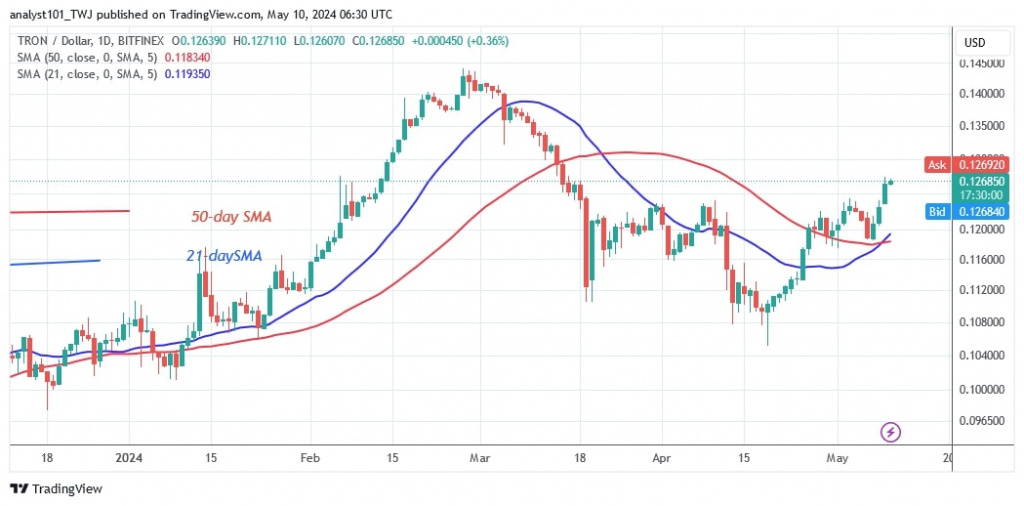
The price of TRON (TRX) is now trading above the moving average lines, continuing its uptrend.
Long-term TRON price forecast: bullish
On April 26, buyers pushed the price above the moving average lines and the positive trend continued. The price of the cryptocurrency tested the 50-day SMA support twice before resuming its uptrend.
On the upside, the altcoin is set to reach a high of $0.144. However, the current rally is expected to face resistance at the $0.14 high. The bullish scenario will be nullified if the altcoin retraces and falls below the moving average lines. TRON is currently worth $0.126.
TRON indicator reading
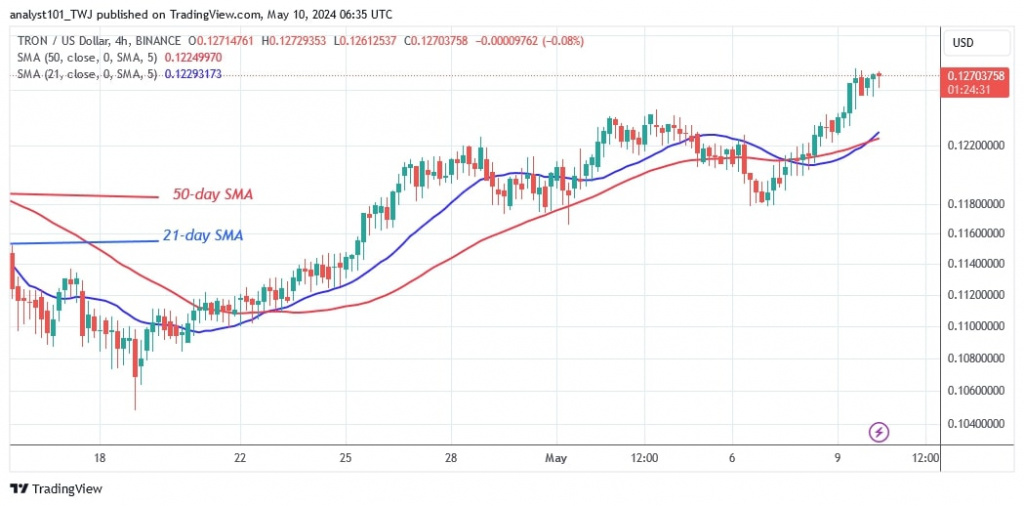
On both charts, the price bars are above the moving average lines, indicating the likelihood of an upward move in the cryptocurrency. In addition, the altcoin has a bullish crossover after the recent price rally. The altcoin has regained its upside momentum, therefore, traders are encouraged to make bullish trades.
Technical Indicators
Key supply zones: $0.09, $0.10, $0.11
Key demand zones: $0.06, $0.05, $0.04

What is the next move for TRON?
The 4-hour chart shows TRON in an uptrend. The cryptocurrency has risen to a high of $0.127. After reaching the resistance level of $0.128, the altcoin has fallen back again. TRON will continue its rise if it pulls back and finds support above the 21-day SMA. The price is currently recovering from the previous breakout level of $0.124.

Disclaimer. This analysis and forecast are the personal opinions of the author and are not a recommendation to buy or sell cryptocurrency and should not be viewed as an endorsement by CoinIdol.com. Readers should do their research before investing in funds.
Price
Price
News
Price
Price

(0 comments)