TRON Holds Above $0.113 As Bulls Try To Stop The Decline

The uptrend of TRON (TRX) ends as the price of the cryptocurrency falls below the moving average lines.
Long-term forecast for the TRON price: bearish
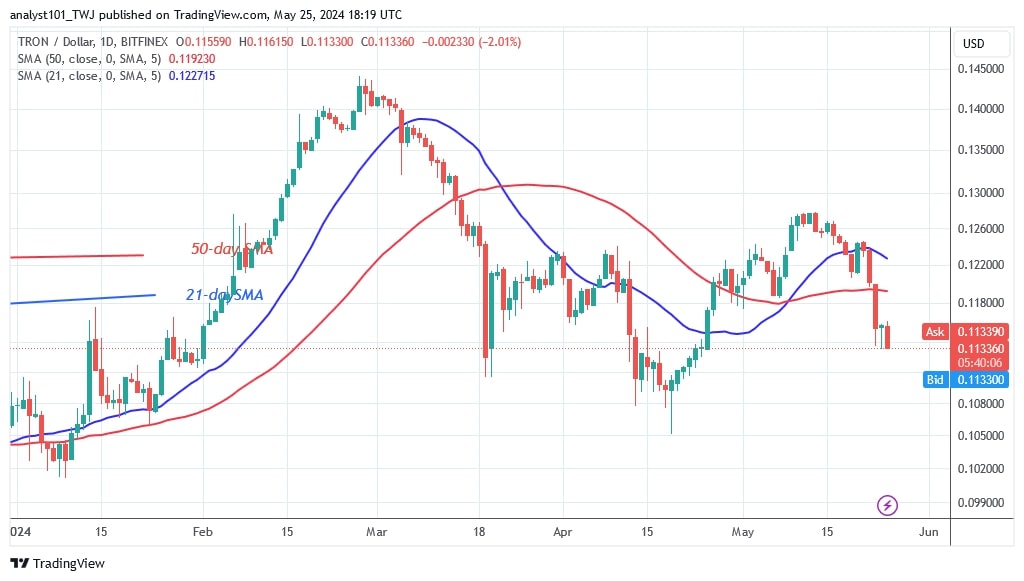
In recent price activity, the altcoin reached a high of $0.128 before falling. On the upside, the bullish scenario has become invalid. TRON has not managed to reach its previous high of $0.14.
On the downside, the cryptocurrency is in a downturn. TRON is declining and approaching its previous low of $0.11. The price of the altcoin is now at $0.113. On the downside, TRON will attract buying pressure if it reaches the previous lows of $0.10 and $0.11 again.
TRON indicator reading
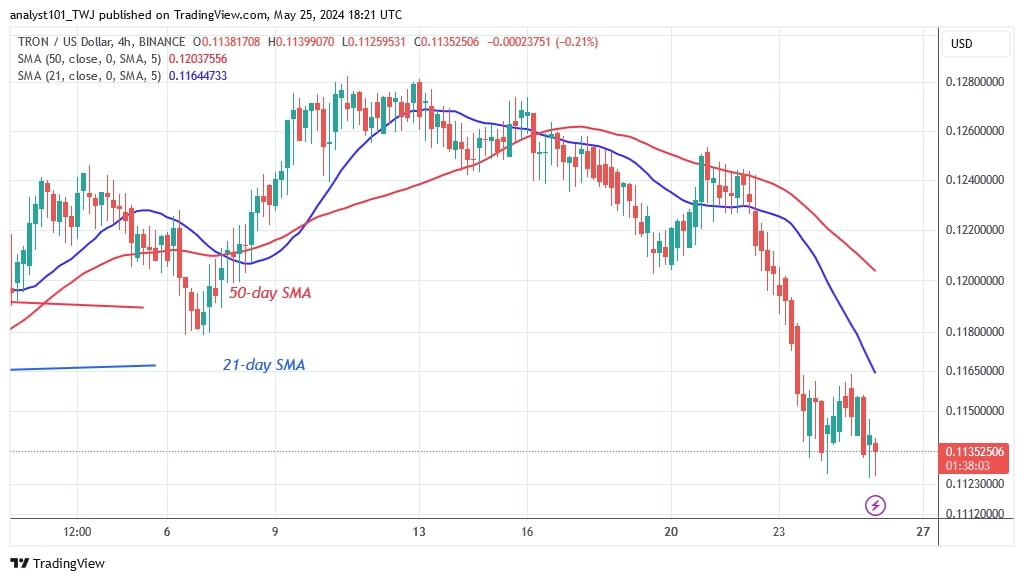
The price bars have fallen well below the moving average lines. The decline is slowing as it approaches previous lows. On the 4-hour chart, the moving average lines have slipped south, indicating a negative trend. On the other hand, the moving average lines are sloping horizontally, indicating a long-term sideways trend on the daily chart.
Technical indicators
Key supply zones: $0.13, $0.14, $0.15
Key demand zones: $0.10, $0.09, $0.08

What is TRON's next move?
On the 4-hour chart, TRON is bearish and has reached its current support level of $0.113. The bears have tested the current level for the third time and are trying to maintain the negative trend. On April 13, TRON fell to a low of $0.10 as the bulls bought the dips. Currently, TRON is consolidating above the $0.113 support.

Disclaimer. This analysis and forecast are the personal opinions of the author and are not a recommendation to buy or sell cryptocurrency and should not be viewed as an endorsement by CoinIdol.com. Readers should do their research before investing in funds.
News
Coin expert
Price
Coin expert
Price

(0 comments)