Toncoin Price Analysis: Uptrend And Approaching The High Of $5.35
Updated: Oct 13, 2024 at 13:05

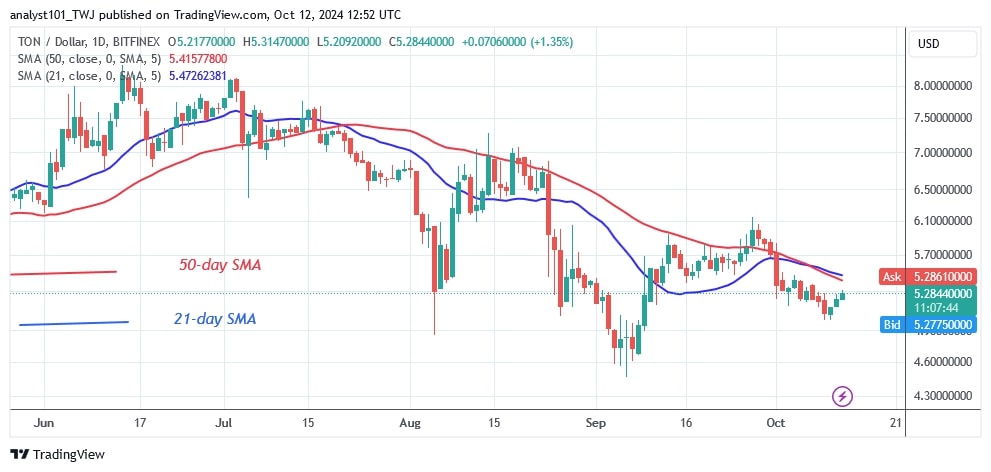
The price of Toncoin (TON) has been moving sideways while in a downtrend. The price drop on August 5 caused TON to fall to a low of $4.86.
Long-term forecast for the Toncoin price: bearish
The bulls bought the dips and forced the cryptocurrency to trade sideways between $4.90 and $6.10. In preparation for a possible trend, TON has been trading sideways for the past two months.
On the downside, selling pressure will increase again if the bears break through the $4.90 support. TON will continue to fall and reach a low of $3.50.
On the upside, the price action will be limited by the moving average lines and resistance at $6.10. Today, the value of the altcoin is at $5.30 as it moves higher.
Analysis of the TON indicator
The price bars are below the moving average lines, which could cause the altcoin to fall even further. The moving average lines are drifting south, indicating a slump. The price movement was limited due to the dominance of the Doji candlesticks.
Technical Indicators
Resistance Levels: $6.00, $8.00, $10.00
Support Levels: $5.00, $3.00, $1.00

What is the next step for Toncoin?
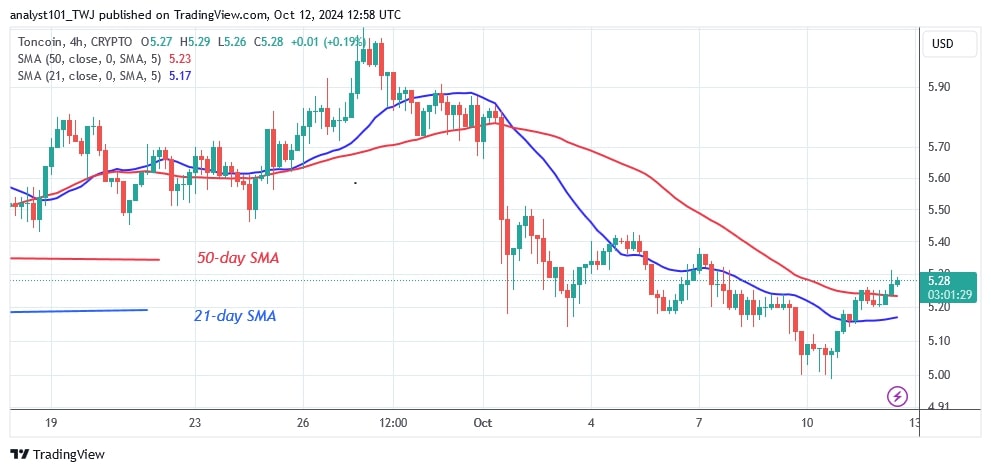
On the 4-hour chart, TON is in a downtrend. The cryptocurrency is showing a pattern of lower highs and lower lows. Today, the altcoin is trending upwards near the moving average lines. The upward movement could encounter resistance at the high of $6.10. A rejection would force the cryptocurrency to decline and start its sideways movement.

Coinidol.com reported on October 6 that TON was trading at $5.31 and predicted that if the 50-day SMA support is broken, the cryptocurrency may fall more.
Disclaimer. This analysis and forecast are the personal opinions of the author. They are not a recommendation to buy or sell cryptocurrency and should not be viewed as an endorsement by CoinIdol.com. Readers should do their research before investing in funds.
Price
Price
News
Coin expert
News

(0 comments)