Toncoin Price Is Showing Turbulent Activity
Updated: Oct 20, 2024 at 13:29

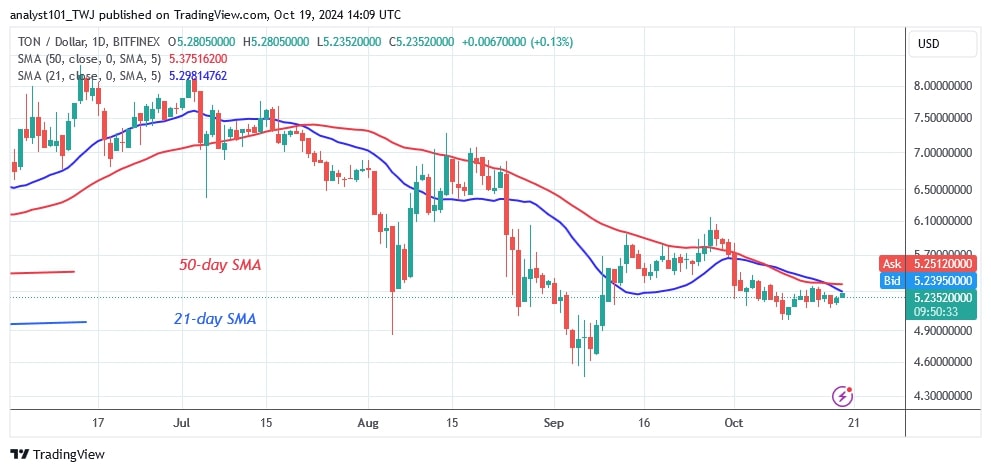
The price of Toncoin (TON) is falling in a sideways trend. Over the past two months, the price of the altcoin has ranged between $4.60 and $6.10. The price of the cryptocurrency has slipped below its moving average lines.
Long-term forecast for the TON price: bearish
Since October 1, the cryptocurrency has consolidated below its moving average lines, as reported by Coinidol.com before. On the upside, TON will resume an uptrend if buyers keep the price above the moving average lines or the $6.10 level. However, price action is being held back by the formation of doji candlesticks. On the downside, TON has consolidated above the $4.90 support level. The value of TON currently stands at $5.25.
Analysis of the TON indicator
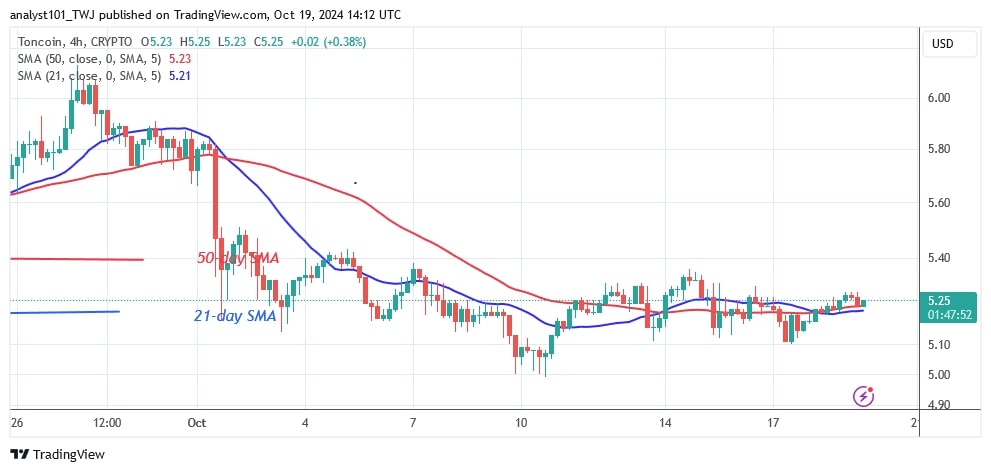
The price bars are below the downward moving average lines. While the doji candlesticks are developing, the price of the cryptocurrency remains stationary below the moving averages. On the 4-hour chart, the price bars are both below and above the horizontal moving average lines.
Technical Indicators
Resistance Levels: $6.00, $8.00, $10.00
Support Levels: $5.00, $3.00, $1.00

What is the next move for Toncoin?
The 4-hour chart shows TON in a sideways trend. The price of the altcoin is moving between $5.10 and $5.40. TON is showing turbulent price activity. The price activity is dominated by small, indecisive candlesticks. Due to traders' hesitation, TON will remain in a trading range for a few more days.

Disclaimer. This analysis and forecast are the personal opinions of the author. They are not a recommendation to buy or sell cryptocurrency and should not be viewed as an endorsement by CoinIdol.com. Readers should do their research before investing in funds.
News
Price
Price
News
Coin expert

(0 comments)