TON Gains But Pauses At The $5.00 Mark
Updated: Nov 08, 2024 at 20:51

Toncoin (TON) is in a downtrend, although the slide has paused above the $4.50 support. Price analysis by Coinidol.com.
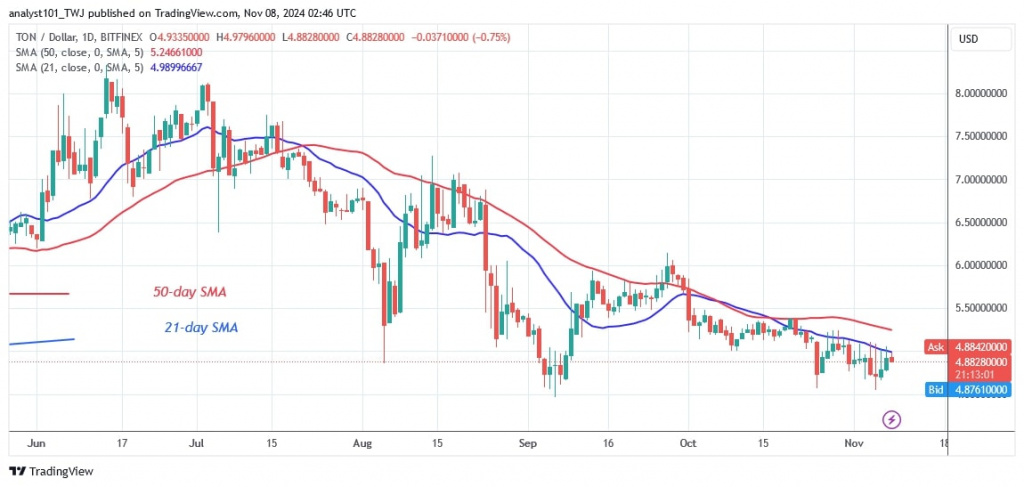
In the meantime, TON is trading above the $4.50 support and below the $6.00 resistance.
TON price long-term prediction: bearish
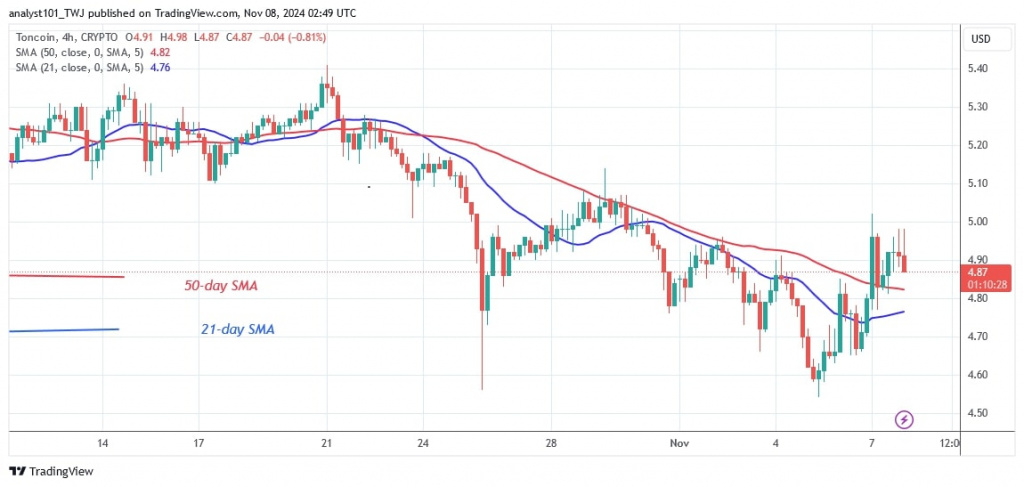
Currently, the price action has paused at the moving average lines. TON is currently trading in a narrow range between the $4.50 support and the moving average lines. This narrow range will lead to a price breakout or breakout. If TON recovers above the current support, it will rise above the moving average lines and reach resistance at $6.00.
However, selling pressure on TON will continue if the bears break through the $4.50 support level. TON is currently trading at $4.97.
TON Indicator Analysis
TON is in a downtrend with the 21-day SMA acting as a barrier to the price rise. In addition, the candlesticks show extended wicks pointing to the 21-day SMA resistance. This indicates strong selling pressure at the recent high.
Technical Indicators
Resistance Levels: $6.00, $8.00, $10.00
Support Levels: $5.00, $3.00, $1.00

What is the next step for Toncoin?
TON is in an upward correction as it rises above the moving average lines. The bullish momentum paused around the $5.00 resistance level.
Today, the altcoin has retraced above the moving average lines, indicating a probable uptrend for the cryptocurrency. TON is trading above the moving averages but below the resistance level. TON will continue to rise once resistance is overcome.

Disclaimer. This analysis and forecast are the personal opinions of the author. They are not a recommendation to buy or sell cryptocurrency and should not be viewed as an endorsement by CoinIdol.com. Readers should do their research before investing in funds.
News
Price
Price
News
Coin expert

(0 comments)