Ripple Is In a sideways Movement, Struggling With Resistance at $0.80

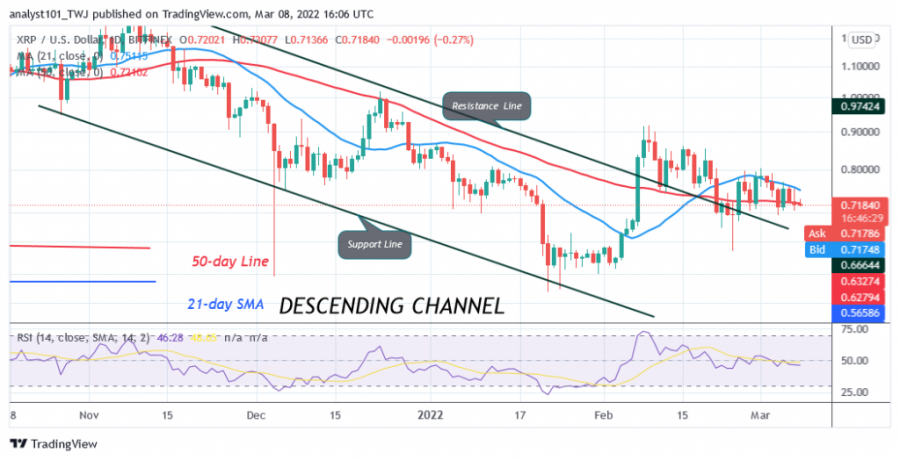
The price of Ripple (XRP) is in a downward correction as the price fluctuates between the moving averages.
Ripple (XRP) Price Long-Term Forecasts: Bearish
Today, a bullish candle is showing above the support at $0.72. If the altcoin rises above the 50-day moving average and holds there, XRP will move back within a trading range for a few days. This is because Ripple will trade above the moving average of the 50-day line, but below the moving average of the 21-day line. The altcoin will move when the moving average lines are broken.
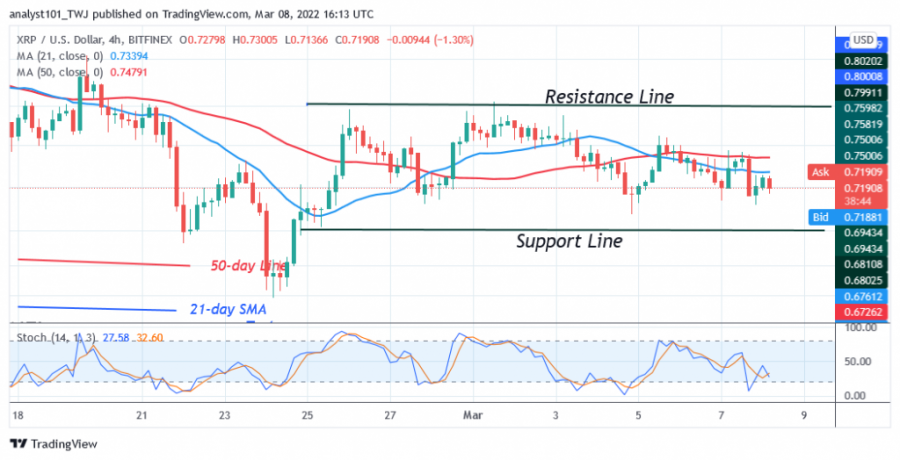
Since February 26, buyers found it difficult to overcome the resistance at $0.80, hence the sideways movement. Meanwhile, XRP/USD resumed its bullish momentum above the $0.72 support.
Ripple (XRP) Indicator Analysis
XRP has fallen to the 46 level of the Relative Strength Index for the 14 period. The cryptocurrency is in the downtrend zone and below the centre line 50. XRP is capable of falling into the downtrend zone if the price drops below the moving averages of the 50-day line. Ripple is below the 50% range of the daily stochastic. The bearish momentum is unstable as the market continues its rangebound move.
Technical Indicators:
Key resistance levels - $1.95 and $2.0
Key support levels - $0.80 and $0.60

What is the next move for Ripple (XRP)?
On the 4-hour chart, XRP/USD is in a sideways movement. The market is fluctuating between the price levels of $0.68 and $0.80. The bulls were rejected three times at the high of $0.80. The uptrend will resume when the resistance level is broken.

Disclaimer. This analysis and forecast are the personal opinions of the author are not a recommendation to buy or sell cryptocurrency and should not be viewed as an endorsement by CoinIdol. Readers should do their own research before investing
News
News
Price
Coin expert
Price

(0 comments)