Ripple Shows Signs of Decline as It Drops Below $0.28 and Retests It

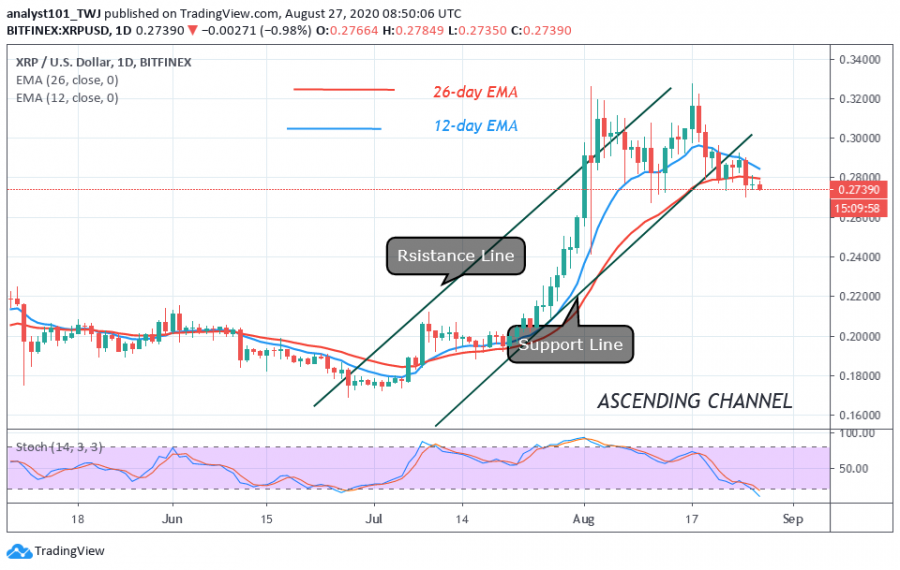
For the past 48 hours, sellers have been in control of price as the $0.28 support was breached. The $0.28 support has been holding since August 1 but the recent price action has compelled XRP to continue the downward move.
On August 25, the bears broke the $0.28 support as the price reached a low of $0.27. Ripple has continued the downward move after resting the $0.28 high. Today, Ripple has fallen to $0.274 low at the time of writing. XRP may hold and resume upward as it was in the previous cases. However, the downward move will be accelerated once the $0.27 support is broken. Ripple may fall to $0.25 low if selling pressure persists.
Ripple indicator analysis
The crypto has fallen into the bearish trend zone as price breaks below the EMAs. This indicates that the coin is likely to fall. The coin has fallen below a 20% range of the daily stochastic. It indicates that price is in a bearish momentum and it is approaching the oversold region. Buyers will emerge when the coin reaches the oversold region.

Key Resistance Zones: $0.35, $0.40, $0.45
Key Support Zones: $0.25, $0.20, $0.15
What is the next move for Ripple?
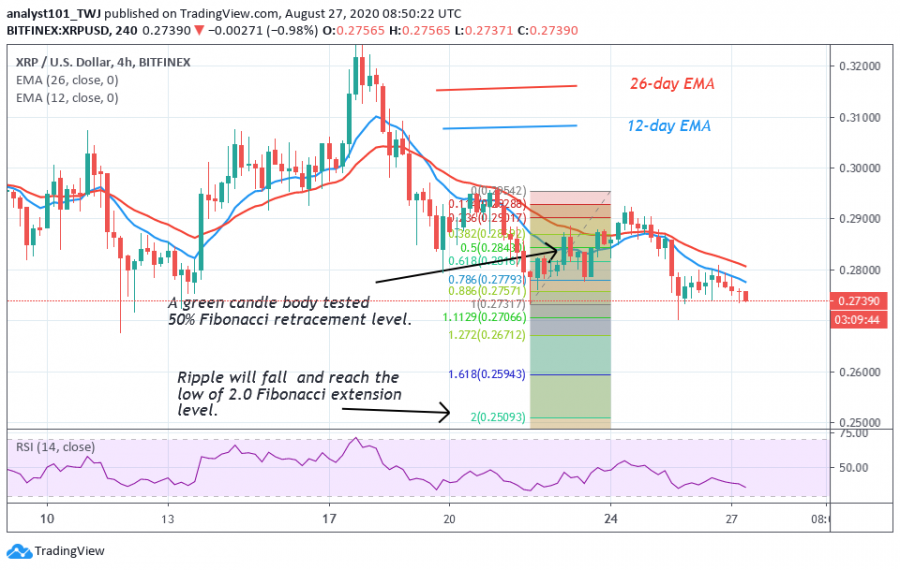
XRP is falling after retesting the 12-day EMA. On August 22 downtrend, XRP reached the $0.273 low and resumed upward. A green candle body tested the 50% Fibonacci retracement level. The implication is that the coin will fall and reach a low of 2.0 Fibonacci extension level. That is, XRP may depreciate to the low of $0.25.

Disclaimer. This analysis and forecast are the personal opinions of the author and not a recommendation to buy or sell cryptocurrency and should not be viewed as an endorsement by CoinIdol. Readers should do their own research before investing funds.
Coin expert
Price
Coin expert
Price
News

(0 comments)