Ripple Loses $1.00 Support, Risks Further Decline to $0.65 Low

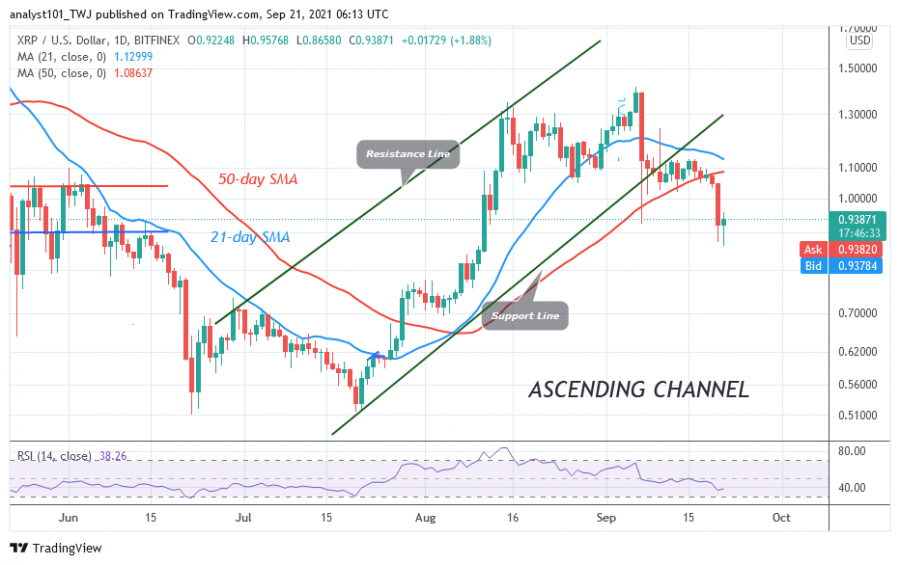
Ripple (XRP) has broken below the 50-day line SMA and hit another low at $0.90. Breaking through the moving averages gives sellers the edge to push prices lower.
Ripple fell to the previous low above $0.92 and continued to consolidate above it. XRP/USD is likely to fluctuate above the current support for a few more days. In the previous price action, XRP consolidated above the $1.0 support for two weeks before the altcoin fell back to the $0.92 support. Today, buyers are pushing the altcoin towards the previous highs, while it is facing rejection at the recent high. However, if the bears break the current support at $0.92, XRP will continue to fall to the lows of $0.70. In the meantime, XRP is still fluctuating above the current support as buyers and sellers are still undecided.
Ripple indicator analysis
Ripple is at level 38 on the period 14 Relative Strength Index, indicating that XRP is in the downtrend zone and approaching oversold territory. The 21-day line SMA and the 50-day line SMA are down, indicating a downtrend. XRP is above the 25% area of the daily stochastic. This suggests that Ripple is in a bullish momentum, but the altcoin is faltering above current support. Ripple is consolidating above $0.92 support as bulls and bears reach a period of indecision.

Technical indicators:
Major Resistance Levels - $1.95 and $2.0
Major Support Levels - $0.80 and $0.60
What is the next move for Ripple?
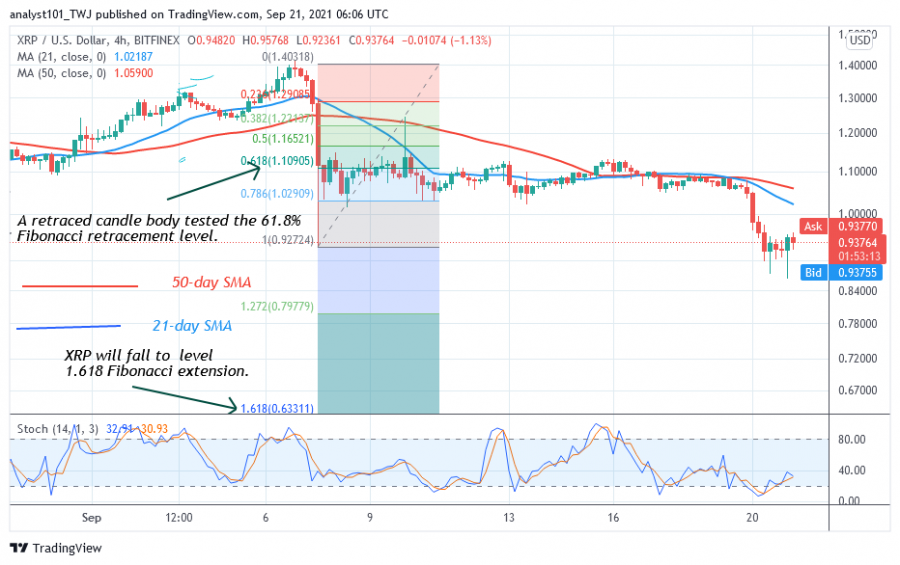
The price of XRP/USD has continued to fall. Further downside depends on the bears breaking the current support. However, the Fibonacci tool has pointed to further downside moves in the altcoin. Meanwhile, the downtrend has shown a candlestick on September 7, testing the 61.8% Fibonacci retracement level. The retracement suggests that XRP will fall to the Fibonacci extension level of 1.618 or the $0.63 level.

Disclaimer. This analysis and forecast are the personal opinions of the author are not a recommendation to buy or sell cryptocurrency and should not be viewed as an endorsement by CoinIdol. Readers should do their own research before investing.
Price
Price
Price
Coin expert
News

(0 comments)