Quant Price Pulls Back After Rejection At $150 High
Updated: Apr 02, 2024 at 10:48

The price of Quant (QNT) has been trading above moving average lines as the altcoin attempts to recover from its downtrend.
Quant price long term forecast: bullish
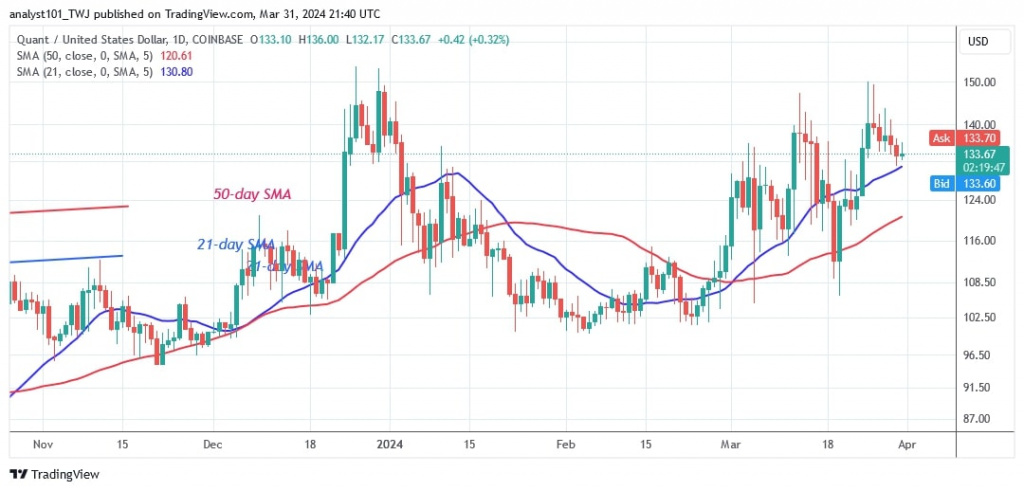
According to price analysis by Coinidol.com, buyers have tried to hold the price above $150 four times since December 26, 2023. On March 25, 2024, the altcoin reached a high of $150 before being pushed back.
QNT has pulled back above the 21-day SMA or the low of $131. The uptrend will continue if the altcoin maintains its 21-day SMA support. QNT will fall if the price drops below the 21-day SMA. The altcoin will fall above the 50-day SMA and eventually reach the previous low at $106.11.
Analysis of quant price indicators
After the recent dip, QNT's price bars are still above the 21-day SMA. The cryptocurrency will rally if the 21-day SMA support holds. On the upside, the altcoin has extended candlestick wicks. A long candlestick wick indicates significant selling pressure at higher price levels. The altcoin will resume its uptrend once it breaks the resistance above $150.
Technical indicators
Important supply zones: $140, $150, $160
Important demand zones: $90, $80, $70

What is the next development for Quant?
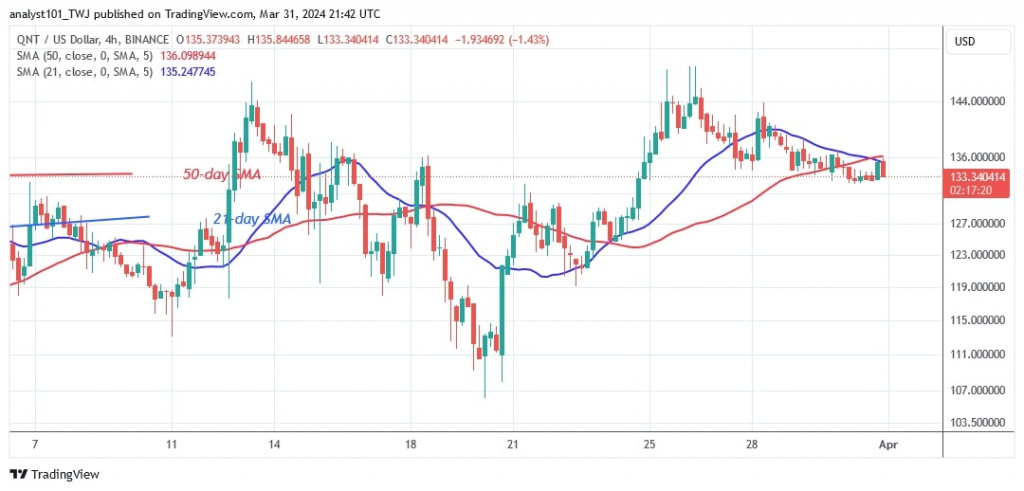
On the 4-hour chart, QNT has been trading in a sideways trend since March 5, 2024. The price of the cryptocurrency has been fluctuating between $112 and $145. The current range is the result of buyers' inability to break through the $150 barrier. If buyers fail to break through the resistance at $150, the existing range will remain unchanged.

Disclaimer. This analysis and forecast are the personal opinions of the author and are not a recommendation to buy or sell cryptocurrency and should not be viewed as an endorsement by CoinIdol.com. Readers should do their research before investing in funds.
News
Coin expert
News
Price
Price

(0 comments)