Quant Retests Support At $98 And Fears Further Decline
Updated: Sep 12, 2023 at 13:38

Cryptocurrency analysts of Coinidol.com report, the price of Quant (QNT) is in a sideways trend, although it is facing a further decline below the existing support.
Quant long-term price forecast: fluctuation zone
Since August 17, the upward movement of QNT has been hindered by the shifting average lines or resistance at the $100 level. The moving average lines have rejected the cryptocurrency's price twice.
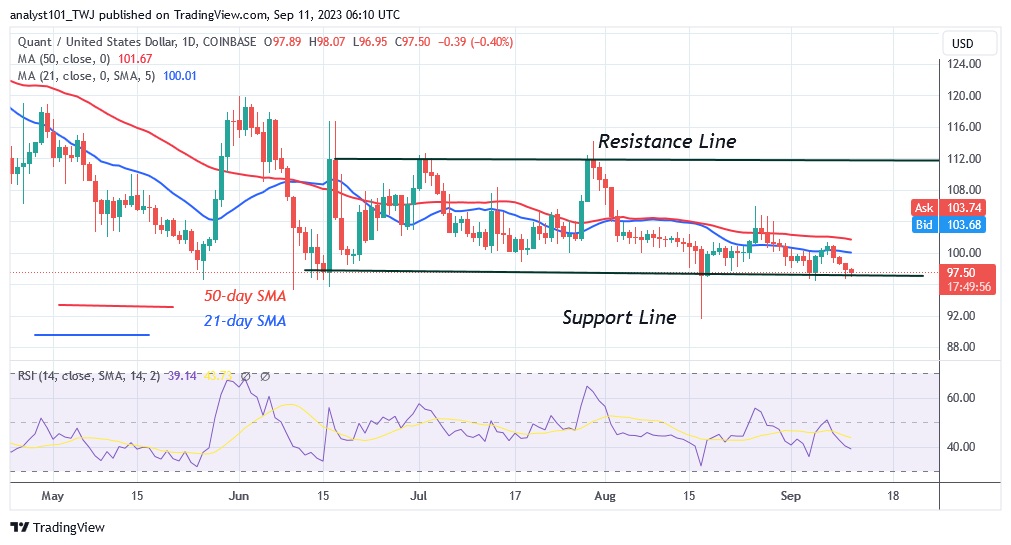
QNT is currently trading in a narrow range between $98 and $100. The market will fall below the previous low of $91 if the bears break the current support. The moving average lines and resistance at $100 could be overcome if the price of the cryptocurrency rises again. The positive trend will continue to the high of $116. Meanwhile, the altcoin is trading in a narrow range above the $98 support.
Quant price indicator analysis
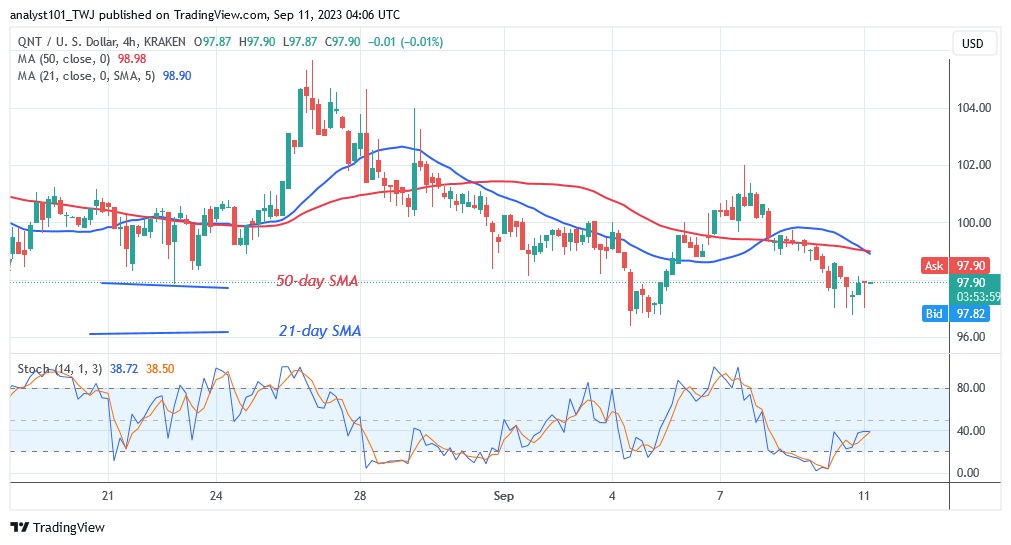
Quant has steadily declined to the Relative Strength Index of 39 during period 14. As it approaches the oversold zone, the altcoin is in a bearish trend zone. The moving average lines are sloping horizontally and are above the price bars. The altcoin is in a range bound move and could go lower. QNT is in a downtrend below the daily stochastic level of 40.

Technical Indicators
Key supply zones: $140, $150, $160
Key demand zones: $90, $80, $70
What is the next move for Quant?
The QNT/USD pair is trading near the bottom of the chart, but in a small range. Since May, the cryptocurrency asset has been trading above the $98 support level. Beyond that, the altcoin is trading only below the $100 resistance level. If the fluctuation range is broken, the cryptocurrency will develop a trend.

As we reported on September 04, The altcoin recovered and broke above the moving average lines on August 26 to reach a high of $105. The positive momentum failed to break through the $112 resistance level, which led to the decline.
Disclaimer. This analysis and forecast are the personal opinions of the author and are not a recommendation to buy or sell cryptocurrency and should not be viewed as an endorsement by CoinIdol.com. Readers should do their research before investing in funds.
News
Price
News
Price

(0 comments)