Polkadot Trades in a Narrow Range and Struggles with the $8 High

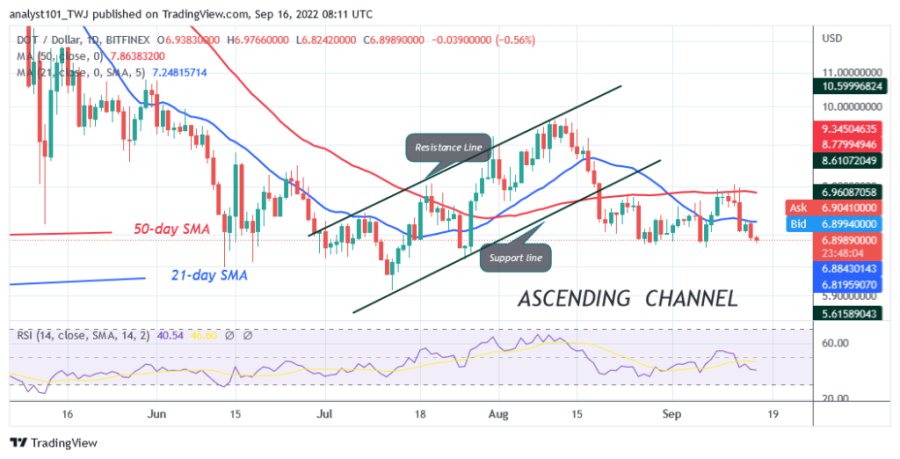
The price of Polkadot (DOT) is in a downtrend as the altcoin drops below the moving average lines. Today, the cryptocurrency value falls to the low of $6.82.
Long-term analysis of the price of Polkadot: bearish
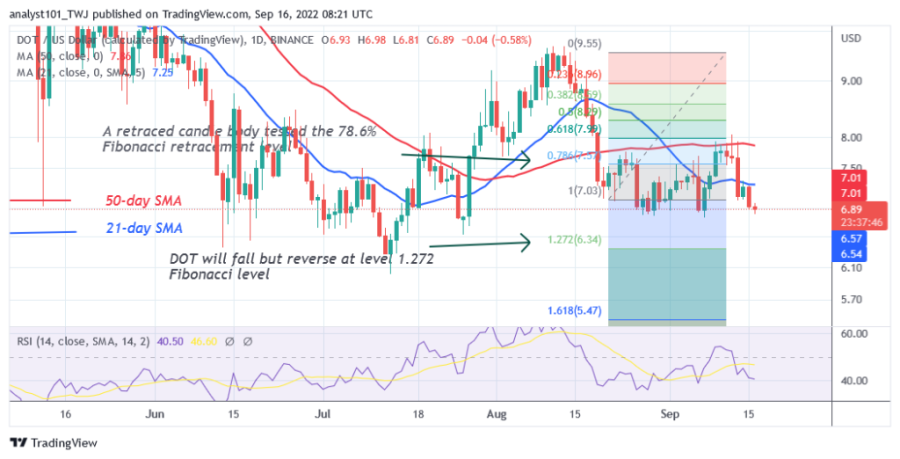
After the August 20 plunge, the price of DOT retested the $6 support three times. Similarly, buyers have tried to keep the price above the 50-day line SMA or the resistance of $8.00, but were rejected. On each rejection, the altcoin fell above the $6.00 support.
The altcoin has fallen to the low of $6.82 as sellers try to push the altcoin above the crucial support of $6.00. If the selling pressure continues, Polkadot will fall further to the previous low of $5.98. On the other hand, if the DOT price recovers and breaks the 21-day line SMA, the altcoin will rise to the 50-day line SMA. On the upside, a recovery to a high of $10 is expected if buyers break the 50-day line SMA or the resistance level of $8.00.
Analysis of the Polkadot indicator
The Polkadot indicator is at the level 39 of the Relative Strength Index for the period 14. DOT The price is in the downward zone after the recent decline. This indicates a further downward trend of the altcoin. DOT The price bars of are below the moving average lines, indicating a further decline in the altcoin. The moving average lines are pointing south, indicating a downward trend.

Technical Indicators
Key resistance zones: $10, $12, $14
Key support zones: $8.00, $6.00, $4.00
What is the next direction for Polkadot?
Polkadot has been in a sideways movement for the past month. The cryptocurrency fluctuates between the price levels of $6.00 and $8.00. The sideways movement becomes necessary as buyers fail to break the 50-day line SMA and the resistance level of $8.00.

Disclaimer. This analysis and forecast are the personal opinions of the author and are not a recommendation to buy or sell cryptocurrency and should not be viewed as an endorsement by CoinIdol. Readers should do their research before investing in funds.
Coin expert
Price
Coin expert
Price
Coin expert

(0 comments)