Polkadot Hovers above $24 Support as It Poises for Upward Move

After an impressive rally, Polkadot (DOT) drops to 21-day SMA support and continues its upward move.
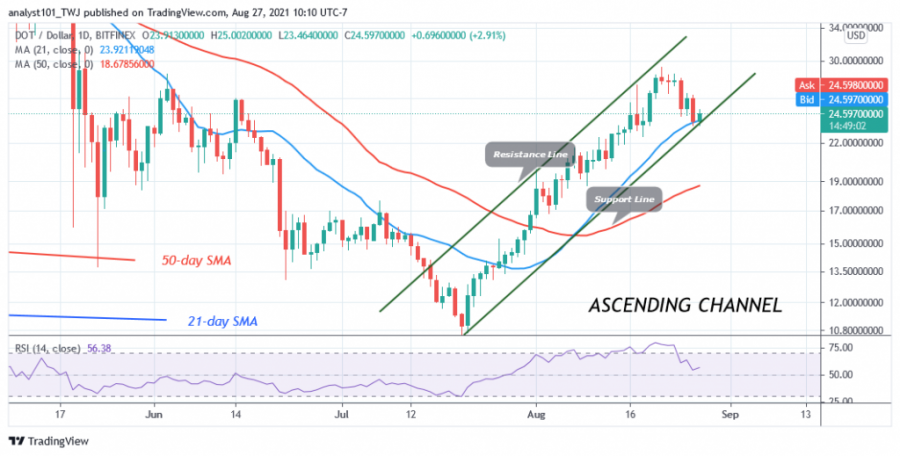
The 21-day SMA line is an important support for the price of DOT, as it tends to rise above the moving averages. In other words, DOT /USD has fallen back to support above $24.
Over the past 48 hours, the DOT price has hovered above $24 support. Earlier price action was held at this support level. The cryptocurrency will move higher if the $24 support holds. The DOT price will regain the previous high of $29.35. Conversely, if the price breaks below the 21-day line SMA or the $24 support, the market will fall to a low of $22. Meanwhile, DOT /USD is trading at $24.59 at the time of writing.
Polkadot indicator analysis
DOT price is at level 56 of the Relative Strength Index of period 14. It indicates that the cryptocurrency is in the bullish trend zone and above the midline 50. The price of the cryptocurrency will rise if the price stays above the moving averages. DOT price is above the 25% range of the daily stochastic. This indicates that the market is in a bullish momentum.

Technical indicators:
Major Resistance Levels - $48 and $52
Major Support Levels - $24 and $20
What is the next direction for Polkadot?
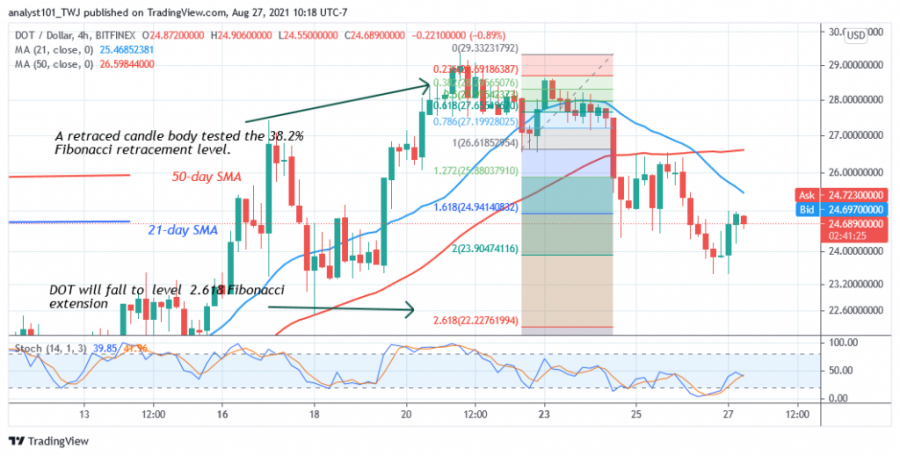
On the 4-hour chart, Polkadot is in a downtrend. DOT price has crossed below the moving averages. Meanwhile, on August 22, the downtrend resulted in a retracement candlestick testing the 38.2% Fibonacci retracement level. The retracement suggests that the DOT price will fall to the 2.618 Fibonacci extension level or the $22.22 level.

Disclaimer. This analysis and forecast are the personal opinions of the author and are not a recommendation to buy or sell cryptocurrency and should not be viewed as an endorsement by CoinIdol. Readers should do their research before investing funds.
News
News
Price
Coin expert
Price

(0 comments)