Litecoin Falls and Retests $47 Twice, Unable to Build on Previous Highs

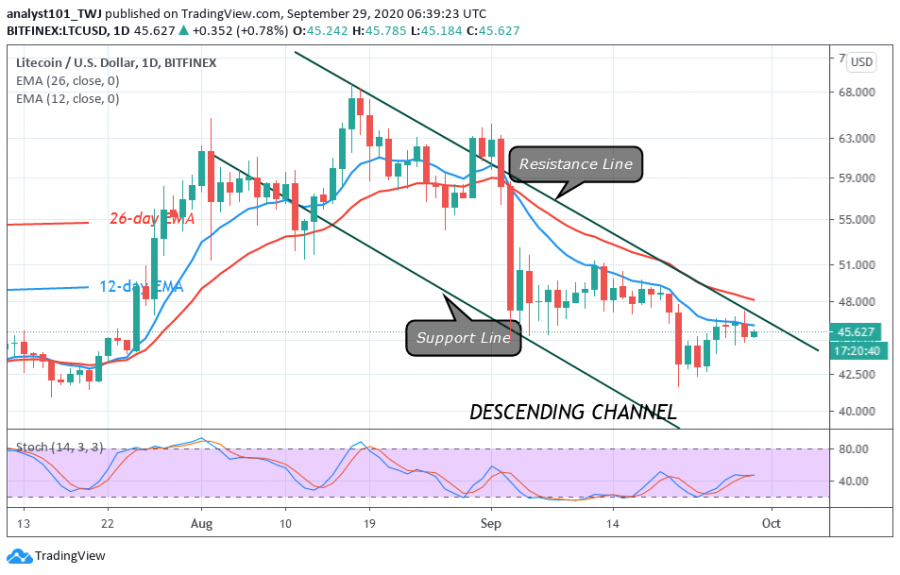
Litecoin (LTC) price analysis, September 29, 2020. Recently, Litecoin rebounded after the coin dropped sharply to $41 low. The strong bounce above $41 propels the coin to reach the $47 high.
Litecoin Price Long-Term Prediction: Bearish
Unfortunately, buyers could not sustain the upward move above the $47 high. LTC slumped down again after retesting the resistance zone. The decline is likely to continue as it faces further selling pressure.
Today, LTC is trading at $45 at the time of writing. On the upside, a strong bounce above the current support could gear up the price to clear the current resistance at $48. The momentum can extend above $51 high. If the bulls are successful, LTC will be out of downward correction. Possibly, the crypto will be trading in the bullish trend zone. On the other hand, if buyers fail to initiate these bullish initiatives, LTC will revisit the previous low at $39.
Litecoin Indicator Analysis
The 12-day EMA is the major resistance to Litecoin as price fails to break above it. The coin will continue to fall as long as the price is below the EMAs. The market will fall if price retests the EMAs and fails to break above it. The coin is in a bullish momentum above the 40% range of the daily stochastic.

Key Resistance levels: $80, $100, $120
Key Support levels: $50, $40, $20
What Is the Next Move for Litecoin?
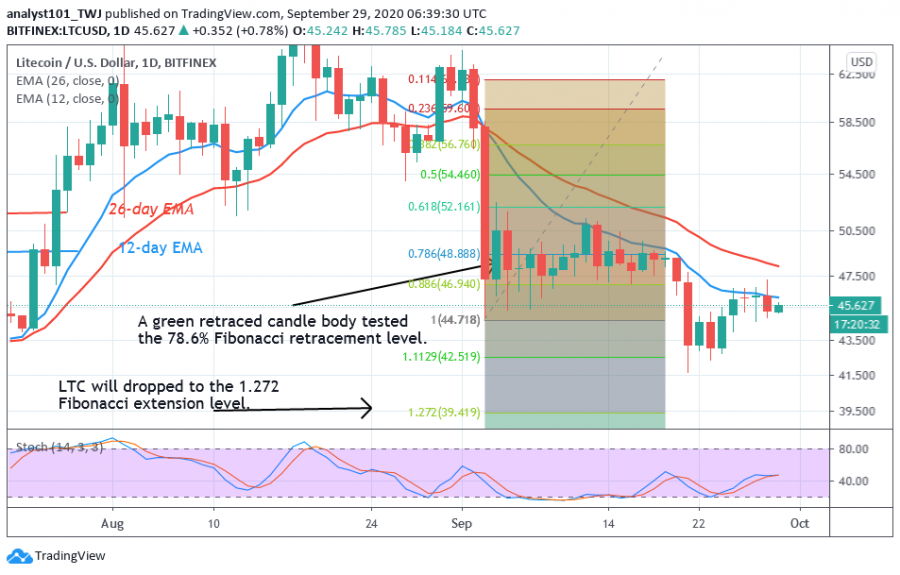
Litecoin is currently above the current support after failing to break above the $47 resistance. The coin is likely to be in a sideways move below the resistance for a few more days. It is unlikely if the bears will retest the current support to break it. The Fibonacci tool analysis will hold if the current support is breached. That is, the market will fall and reach the 1.272 Fibonacci extension or $39 low.

Disclaimer. This analysis and forecast are the personal opinions of the author and not a recommendation to buy or sell cryptocurrency and should not be viewed as an endorsement by CoinIdol. Readers should do their own research before investing funds.
Coin expert
Price
Coin expert
Price
Coin expert

(0 comments)