Litecoin Slips Below Critical Support After Strong Rejection At $76
Updated: Jan 17, 2024 at 12:41

The price of Litecoin (LTC) has fallen again as it encounters rejection at the $76 overhead resistance level. LTC price analysis by Coinidol.com.
Long-term outlook for Litecoin price: bearish
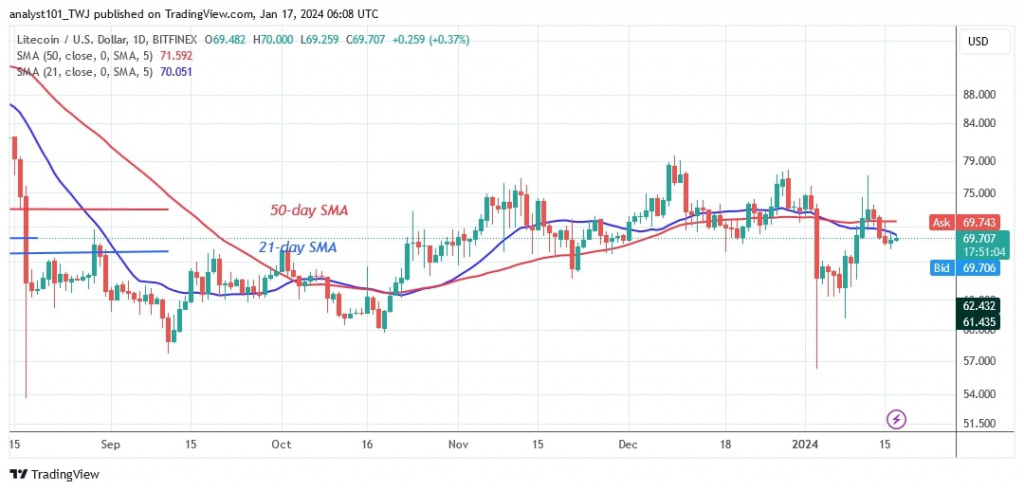
Litecoin is currently trading at $69.39 after falling below the moving average lines. On the upside, buyers have failed to sustain their upside momentum above the $76 high since November 12.
The long candlestick wick from November 12, 2023 indicates strong selling pressure at the $76 overhead resistance level. Litecoin is now in a downtrend and could fall further. The decline will begin if it is rejected at the moving average lines. The downward momentum will continue to the lows of $65 or $63.
Analysis the Litecoin indicators
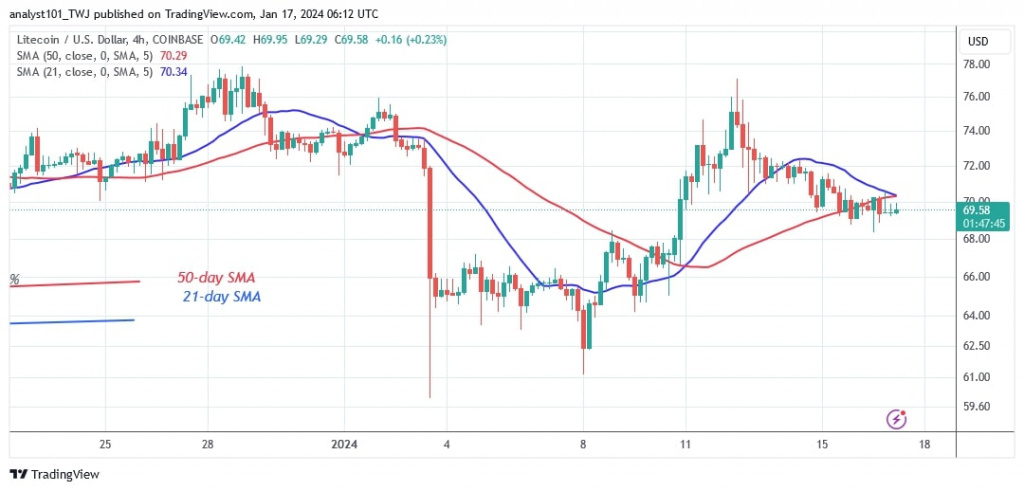
The rejection at $76 has caused the price bars to fall below the moving average lines. Once the price bars fall below the moving average lines, the altcoin is at risk of a decline. The price bars are marked by doji candlesticks, which limit the price movement. The horizontal moving average lines indicate a sideways trend.
Technical indicators
Resistance levels: $100, $120, $140
Support levels: $60, $40, $20

What is the next move for Litecoin
Litecoin has fallen into the downtrend zone and is trading in the previous range bound zone between $60 and $70 price levels. The altcoin has fallen above the $69 support and has resumed consolidation above it. The price action has remained stagnant due to the doji candlesticks.

Disclaimer. This analysis and forecast are the personal opinions of the author and are not a recommendation to buy or sell cryptocurrency and should not be viewed as an endorsement by CoinIdol.com. Readers should do the research before investing in funds.
Price
Price
News
Price
Price

(0 comments)