Litecoin Consolidates Near Resistance Zone for Possible Breakout

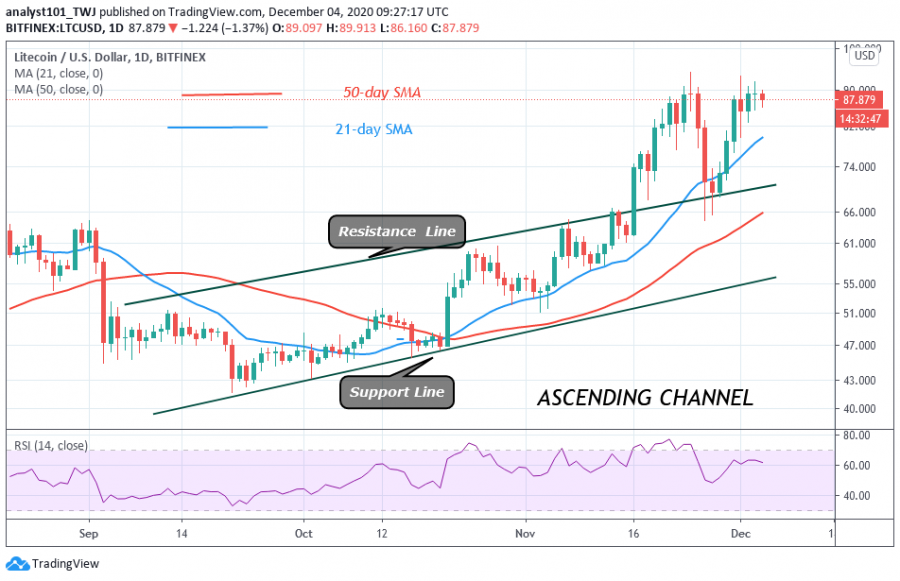
On December 1 uptrend, Litecoin retested the resistance at $90 and was repelled. The coin plunged to $80 low and immediately corrected upward.
The crypto retested the resistance zone and was unable to break it. Presently, Litecoin is in a sideways move and it is consolidating in a tight range between $84 and $90.
The current sideways move will linger on as long as the bulls fail to break the overhead resistance. Nevertheless, if buyers overcome the overhead resistance, the coin will rally above $100. Conversely, if the coin falls as a result of the bearish reaction and the $78 support is breached, the downtrend will resume. Today, Litecoin is trading at $84.86 at the time of writing.
Litecoin indicator analysis
LTC is at level 60 of the Relative Strength Index period 14. It indicates that the coin is in the uptrend zone and above the centerline. The moving averages are sloping upward indicating the uptrend. The 21-day SMA is the support line for the crypto. The downtrend will resume if price breaks below the SMAs.

Key Resistance levels: $80, $100, $120
Key Support levels: $50, $40, $20
What is the next move for Litecoin?
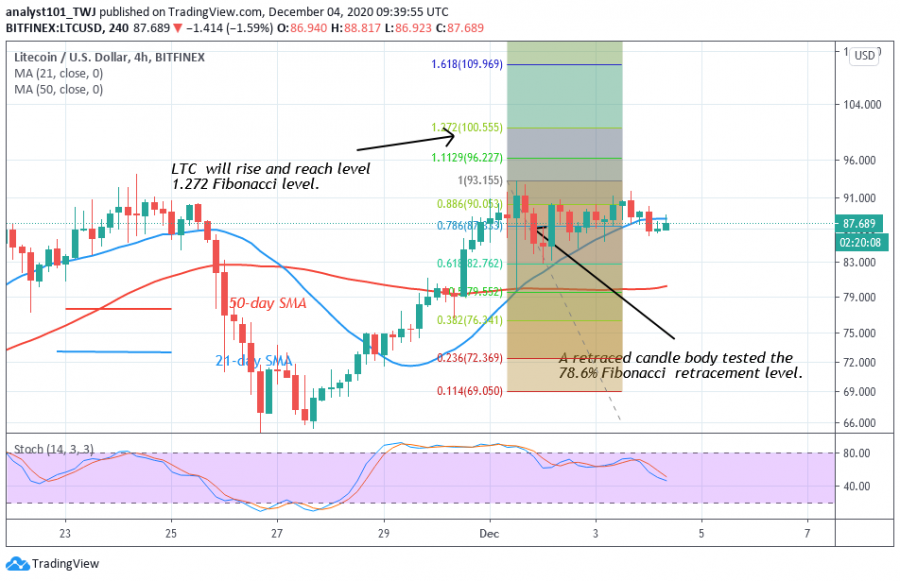
In the current uptrend, the Fibonacci tool has indicated an upward movement of the coin. The retraced candle tested the 78.6% Fibonacci retracement level. The retracement indicates that the crypto will reach level 1.272 Fibonacci extensions. In other words, the coin will reach a high of $100.55 but will reverse at the recent high. However, the reversal will not be immediate.

Disclaimer. This analysis and forecast are the personal opinions of the author that are not a recommendation to buy or sell cryptocurrency and should not be viewed as an endorsement by CoinIdol. Readers should do their own research before investing funds.
Price
Price
Price
Price
Price

(0 comments)