Litecoin (LTC) Ranges after a Breakdown, Is It Time to Buy?

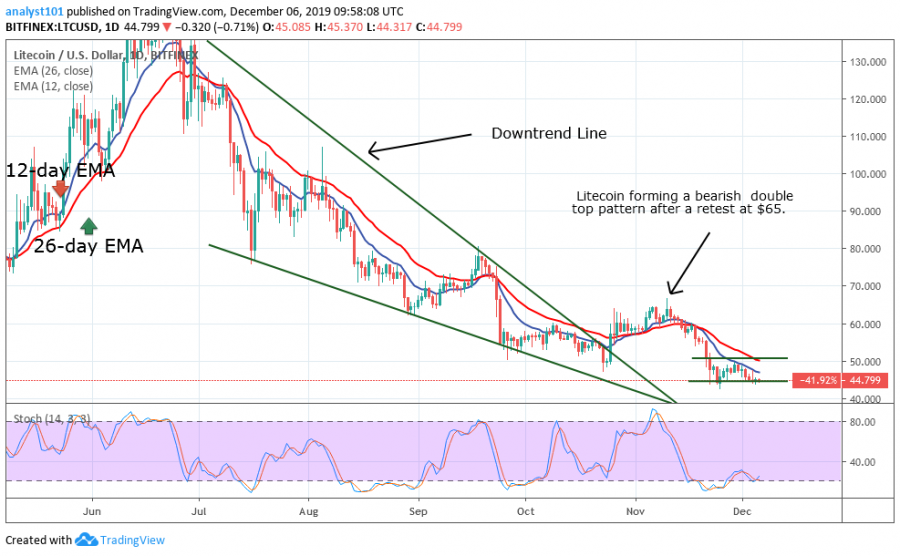
Litecoin crashed to $43 after the last bearish impulse. Previously, the coin had been trading above $50 for over a month before the market went up. This sudden price jump hit resistance at $65. After a pullback, the bulls retested the resistance to form a bearish double top pattern. This pattern formation led to a further drop of Litecoin to a low of $43.
After falling to its current low, Litecoin moves up again but faces a hurdle at the $50 resistance level. Earlier the $50 price level had provided support before turning into resistance level. In the meantime, the pair fluctuates above the support of $43. Any attempt by the bears to break this low will result in another low of $36.
Litecoin Indicator Analysis
The bulls broke the downtrend line and commenced a bullish move. This uptrend was short-lived as the bulls were resisted at $65. The stochastic is horizontal above the 20% range meaning that the bullish momentum is weak.

Key Supply Zones: $80, $100, $120
Key Demand Zones: $50, $40, $20
What Is the Next Direction for Litecoin?
Litecoin had earlier attempted to reverse after breaking the downtrend line. It came under another selling pressure as the market resumes its downtrend. The pair consolidates at its low above $43. It fluctuates within a price range of $43 and $50. A breakdown or breakout will determine the direction of the coin.
Disclaimer. This analysis and forecast are the personal opinions of the author are not a recommendation to buy or sell cryptocurrency and should not be viewed as an endorsement by CoinIdol. Readers should do their own research before investing funds.
Price
Price
Price
Price
Price

(0 comments)