Litecoin Is in a Narrow Range as It May Decline to $48 Low
Updated: Oct 19, 2022 at 12:22

Litecoin (LTC) price is in a downtrend as it falls to the $50 low and resumes its upward move. In the last 48 hours, Litecoin has been making bullish moves.
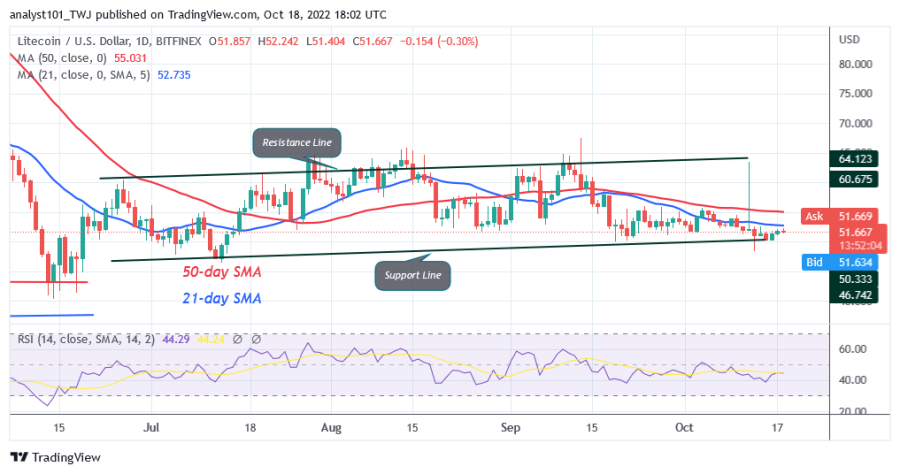
The upside is facing resistance at the $52 high or the 21-day moving average line. In the previous price action, the altcoin was trading between $50 and $56. Today, the upside move is met with rejection at the $52 resistance or the 21-day SMA. The crypto can rally above the moving average lines and bullish momentum will reach the $64 high if there is a price rally.
Conversely, if the altcoin turns down from the moving average lines, it can also drop to the previous low of $48.
Litecoin indicator analysis
Litecoin is in a downtrend at level 45 of Relative Strength Index for period 14. Upward correction is rejected at recent high. The moving average lines are slanted horizontally and indicate the sideways trend.
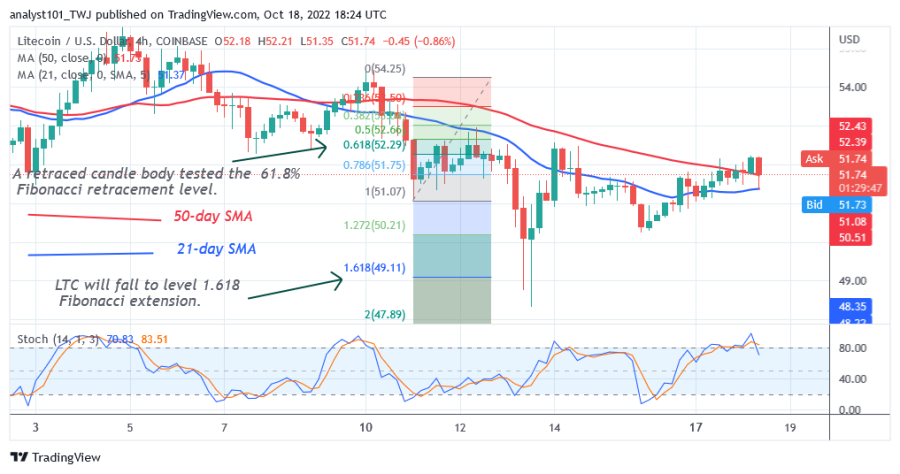
LTC price is trading above the 80% range of the daily stochastic. The cryptocurrency can fall if it reaches the overbought region of the market.

Technical indicators:
Major Resistance Levels - $200 and $250
Major Support Levels - $100 and $50
What is the next move for Litecoin?
Litecoin could resume selling pressure as it trades in the overbought region of the market. Upward moves were rejected at the recent high. From Fibonacci analysis, LTC price corrected up to 61.8% Fibonacci retracement level. The implication is that it will fall to the Fibonacci extension from 1.618 or $49.11.

Disclaimer. This analysis and forecast are the personal opinions of the author and are not a recommendation to buy or sell cryptocurrency and should not be viewed as an endorsement by CoinIdol. Readers should do their own research before investing in funds.
News
Price
News
Price
Price

(0 comments)