Litecoin Consolidates Above $144 Support as Buyers and Sellers Remain undecided
Updated: Jan 05, 2022 at 10:37

Litecoin (LTC) price is in a downward correction as the altcoin falls below its moving averages. LTC price's recovery is being hindered by resistance at $165.
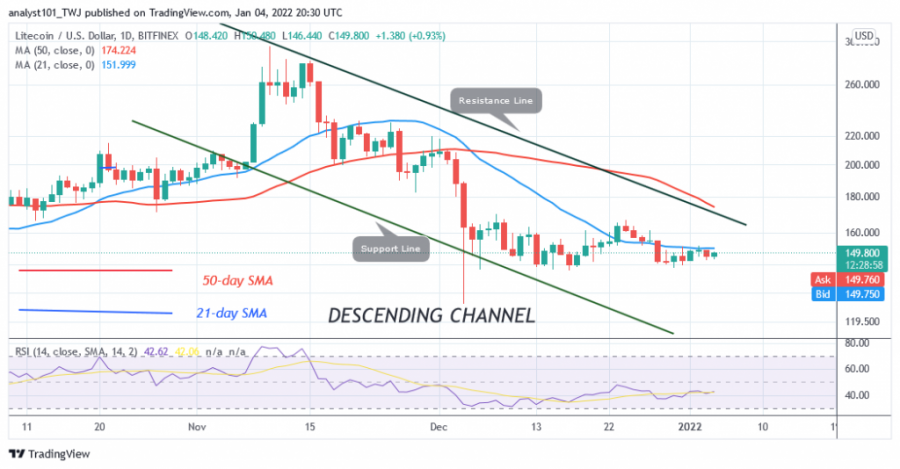
Sellers have pushed the bullish momentum back into the rangebound zone. Today, the LTC price is consolidating above the $144 support. It is also below the blue line, the 21-day moving average.
Last week's price consolidation was marked by small indecisive candlesticks called doji and spinning tops. These candlesticks indicate that buyers and sellers are undecided as to the direction of the market. However, if the bears break below the $144 support, the altcoin will fall to a low of $126. On the upside, Litecoin bulls need to break through $165 and $200 resistance to get out of the downside correction.
Litecoin indicator analysis
First and foremost, the cryptocurrency could fall further as LTC prices are below the moving averages. Litecoin is at level 42 of the Relative Strength Index of period 14. The market is in the downtrend zone and below the midline 50. Similarly, it is above the 40% area of the daily stochastic. Bullish momentum is capped below the high at $160.

Technical Indicators
Resistance Levels: $240, $280, $320
Support Levels: $200, $160, $120
What is the next move for Litecoin?
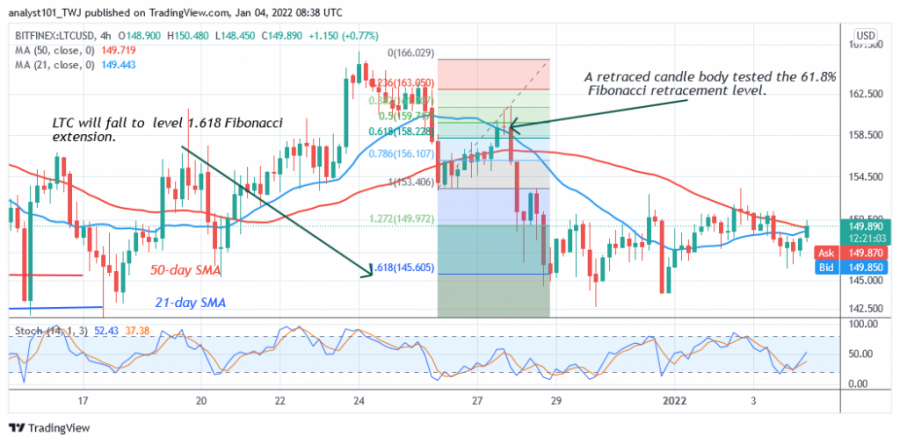
Litecoin is in a downward correction and at the bottom of the chart. The current downtrend has abated as the market fluctuates above $144 support. According to the Fibonacci tool, the downtrend tested the 61.8% Fibonacci retracement level on December 26 through a retreating candlestick. The retracement suggests that LTC will fall to the 1.618 Fibonacci extension level or $145.60.

Disclaimer. This analysis and forecast are the personal opinions of the author and are not a recommendation to buy or sell cryptocurrency and should not be viewed as an endorsement by CoinIdol. Readers should do their own research before investing funds.
Price
Price
Price
News
Price

(0 comments)