Litecoin Continues Its Downward Move, Revisits $126 Low

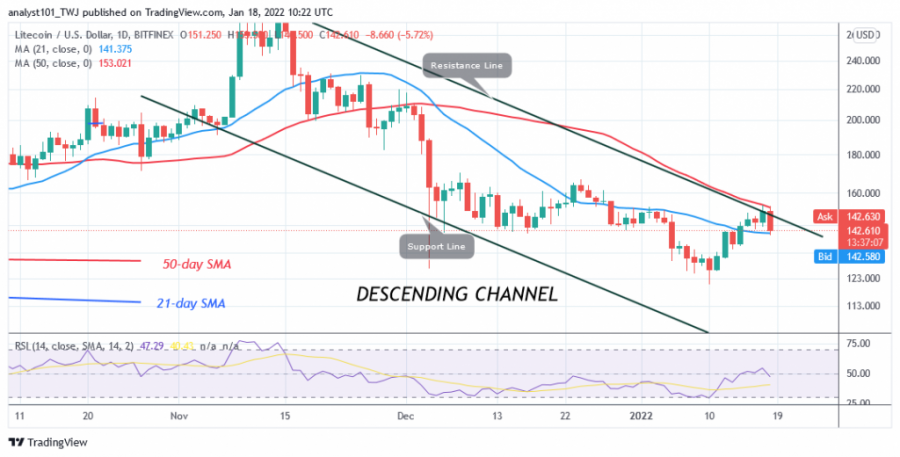
Litecoin (LTC) price is in a downward correction but is trading above the 21-day moving average line and below the 50-day moving average line. The altcoin is fluctuating between the moving averages.
The cryptocurrency could resume its uptrend if the price breaks above the 50-day moving average line. Similarly, the downtrend will resume if the price falls below the 21-day moving average line. Yesterday, the LTC price corrected upwards, but was caught at the high of $152.
If the bulls had overcome the recent high, the LTC price would have risen above the moving averages. Moreover, the downward correction would have ended then. Meanwhile, Litecoin is falling today and has found support above the $140 low or the 21-day moving average line. The uptrend will continue if the current support holds. Litecoin will fall to a low of $126 if current support is broken.
Litecoin indicator analysis
Litecoin is at the 47 level of the Relative Strength Index of period 14. The cryptocurrency is in the downtrend zone and below the midline 50. The LTC price bar is between the moving averages, which indicates a possible movement within a certain range. The moving averages of the 21-day line and the 50-day line are sloping south, indicating a downtrend. The altcoin is below the 50% area of the daily stochastic. This indicates that the market is in a bearish momentum.

Technical Indicators
Resistance Levels: $240, $280, $320
Support Levels: $200, $160, $120
What is the next move for Litecoin?
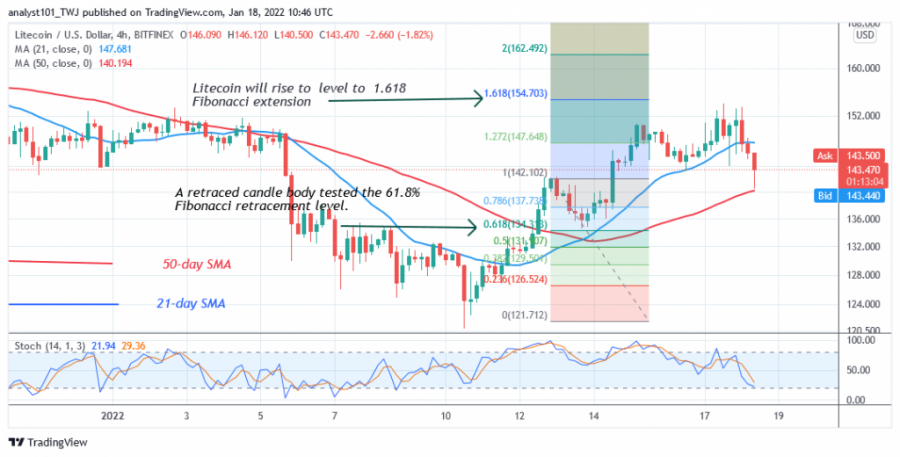
On the 4-hour chart, Litecoin is in an uptrend. The uptrend has been broken at the high of $152. The price indicator also suggests a possible upward movement of the altcoin. On January 13, a retracement candlestick tested the 61.8% Fibonacci retracement level. The retracement suggests that Litecoin will rise to the Fibonacci extension level of 1.618 or $154.70. The price action shows that the LTC price reached the high of $152 and then reversed.

Disclaimer. This analysis and forecast are the personal opinions of the author and are not a recommendation to buy or sell cryptocurrency and should not be viewed as an endorsement by CoinIdol. Readers should do their own research before investing funds.
Price
Price
Price
Price
Price

(0 comments)