Ethereum Rebounds Above $364 Low but May Face Another Rejection

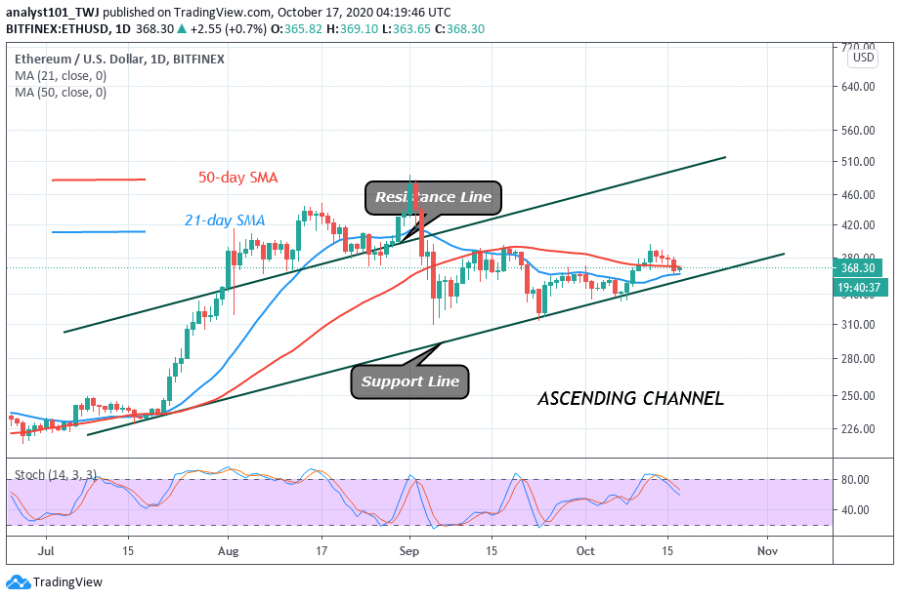
On October 12, the biggest altcoin faced rejection at the $395 overheard resistance. After Ether was repelled the coin dropped to $368 low.
There are indications that sellers may push the coin below the moving averages or the critical support at $350. This may portend negatively for the coin if the bears are allowed to have an undue advantage at this price level.
For example, if Ethereum retraces and finds support above $350, the upside momentum is likely to be revived. Buyers will attempt to push the price above $395 overhead resistance. This will catapult the coin to $488 high. On the other hand, if the bears break the $350 support, Ether will fall to the previous low at $310. A break below the $350 support will automatically affect the breaking of the moving averages. Perhaps, Ether will be range-bound in the bearish trend zone for a few days. The price action is indicating bearish signals.
Ethereum indicator analysis
Ether price has broken the 50-day SMA but finds support above the 21-day SMA. The upward move will resume if the current support holds. The coin is below the 80% range of the daily stochastic. ETH has been in a bearish momentum. This is because it was trading in the overbought region since October 10.

Key Resistance Zones: $220, $240, $260
Key Support Zones: $160, $140, $120
What is the next direction for Ethereum?
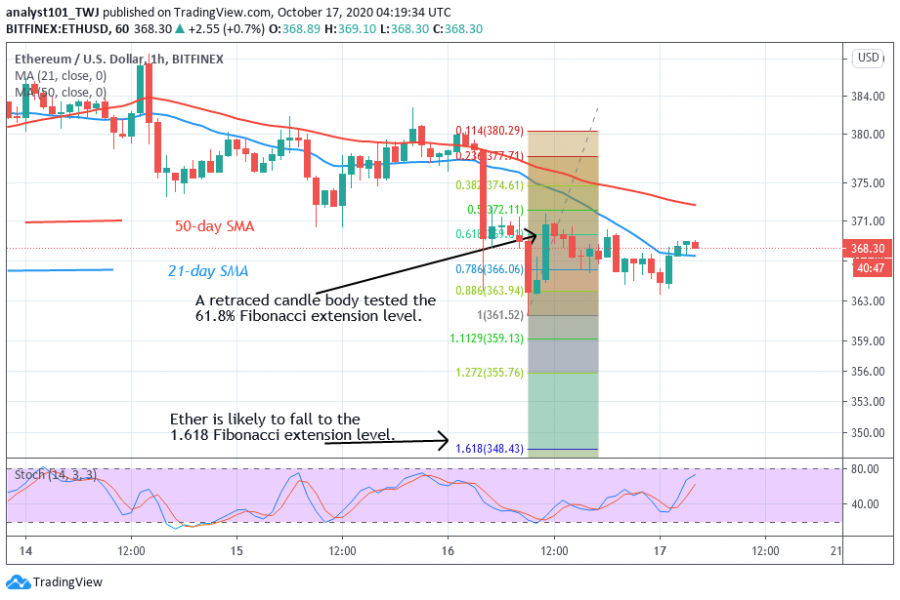
From the current price action, it appears the coin will further depreciate if it faces rejection at the recent high. Besides, on October 16 downtrend, the retraced candle body tested the 61.8% Fibonacci retracement level. This indicates that the coin will further depreciate to level 1.618 Fibonacci extension. That is a low of $348.43.

Disclaimer. This analysis and forecast are the personal opinions of the author that are not a recommendation to buy or sell cryptocurrency and should not be viewed as an endorsement by CoinIdol. Readers should do their own research before investing funds.
Price
Price
News
News
Price

(0 comments)