Ethereum Declines as It Continues to Face Rejection at the $480 Overhead Resistance

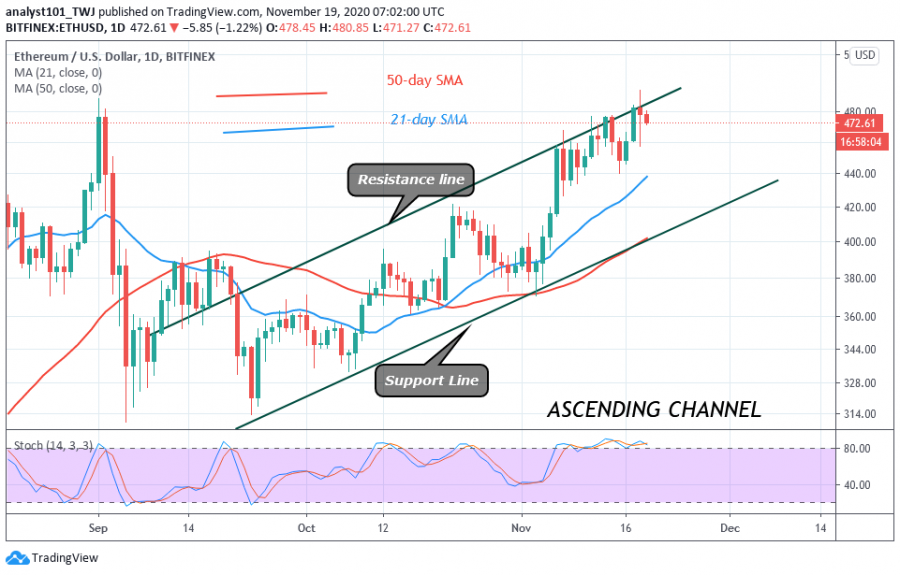
Yesterday, Ethereum bulls surprisingly broke the resistance at $480 as the coin rallied to $494 high. Unfortunately, the bulls failed to sustain the uptrend as Ether plunged to $458 low.
The price corrected upward twice to retest the resistance zone. On each retest at the resistance, the biggest altcoin will face rejection at the recent high. The coin is falling and approaching the low at $472 at the time of writing. On the downside, if the price falls and breaks below the support at $450, the downtrend will continue to linger.
The current selling pressure may reach a low of $400. Conversely, if price retraces and finds support above $450, the upside momentum will resume. The coin will rise again and consolidate near the resistance zone until a breakout is achieved. The first target after the breakout will be at $488. Subsequently, the momentum will extend to $520.
Ethereum indicator analysis
Since November 6, Ethereum has been above the 80% range of the daily stochastic. This implies that the biggest altcoin has been trading in the overbought region. It shows that the bulls are in control of price. The overbought condition may not hold in a strong trending market. Sellers may emerge if the market is not trending.

Key Resistance Zones: $440, $460, $480
Key Support Zones: $160, $140, $120
What is the next direction for Ethereum?
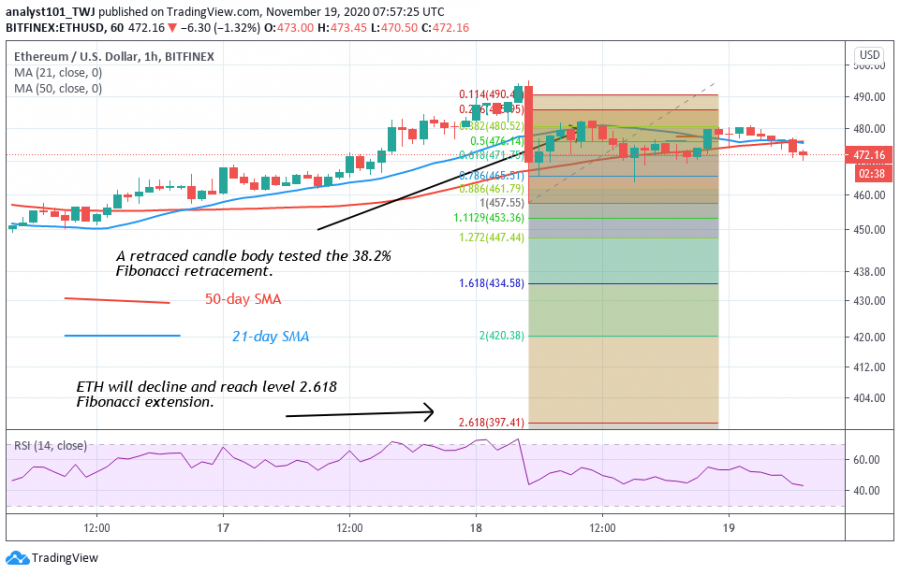
Ethereum is currently facing rejection at the $480 resistance zone. According to the Fibonacci tool analysis, Ethereum is likely to decline on the downside. On November 18, a retraced candle body tested the 38.2% Fibonacci retracement level. This retracement indicates that the coin will fall to level 2.618 Fibonacci extensions. That is low of $397.41.

Disclaimer. This analysis and forecast are the personal opinions of the author that are not a recommendation to buy or sell cryptocurrency and should not be viewed as an endorsement by CoinIdol. Readers should do their own research before investing funds.
News
Coin expert
Price
Coin expert
Price

(0 comments)