Ethereum Is Circling Above $1,507 as It Approaches the Next Obstacle

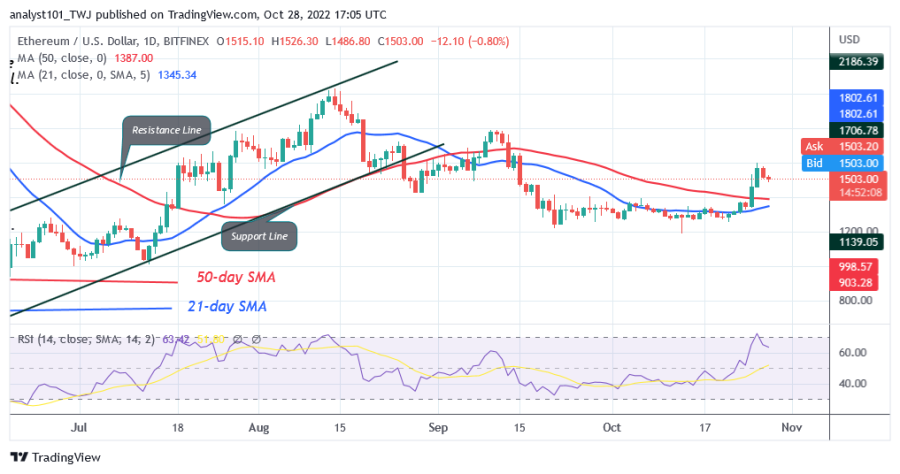
Ethereum (ETH) is in an uptrend and breaking out above the moving average lines. The Ether price rose to a high of $1,596, but is rejected at the recent high. Today, the cryptocurrency has suffered a setback and is moving above the support of $1,507.
In other words, it is trading between the price levels of $1,400 and $1,600. If the buyers break the resistance at $1,600, the market will rise to $1,800 and $2,019. Conversely, if Ether falls back below the support at $1,400, the downtrend will continue. Ether will then fall to the range between $1,220 and $1,400. In the meantime, the altcoin is trading above the $1,507 support.
Ethereum indicator analysis
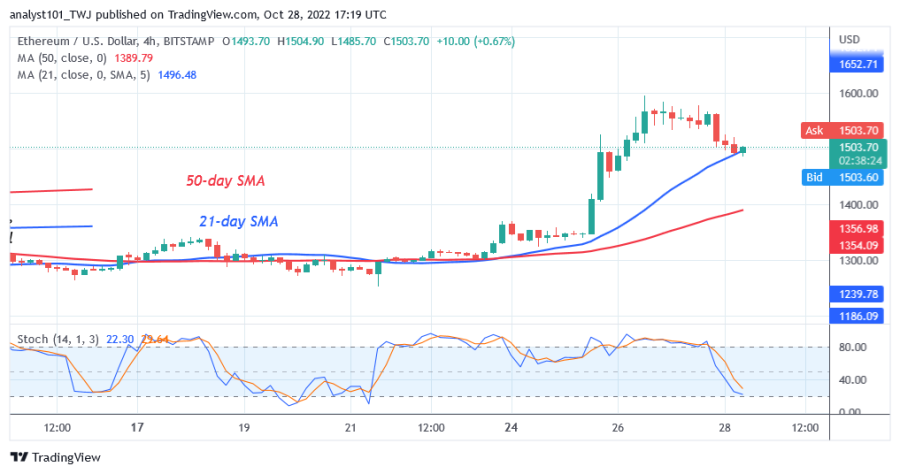
According to the period 14 Relative Strength Index data, the largest altcoin is at level 63. The altcoin is in the bullish trend zone and could continue to rise. The fact that the price bars are above the moving average lines suggests that the value of the currency could increase. Ether is below the 40% zone of the daily stochastic, which indicates bearish momentum.

Technical indicators:
Major Resistance Levels - $2,000 and $2,500
Major Support Levels - $1,500 and $1,000
What is the next direction for Ethereum?
On the 4-hour chart, the largest altcoin has retreated above the 21-day line SMA. If the 21-day line SMA holds, Ethereum will start a new uptrend. Above the 21-day line SMA there is a bullish candle. This is an indication of a possible uptrend.

Disclaimer. This analysis and forecast are the personal opinions of the author and are not a recommendation to buy or sell cryptocurrency and should not be viewed as an endorsement by CoinIdol. Readers should do their research before investing in funds.
Price
Coin expert
Price
Price
Price

(0 comments)