Ethereum Faces another Decline as Bulls Fail to Sustain Above $3,515.40 High
Updated: Sep 10, 2021 at 10:57

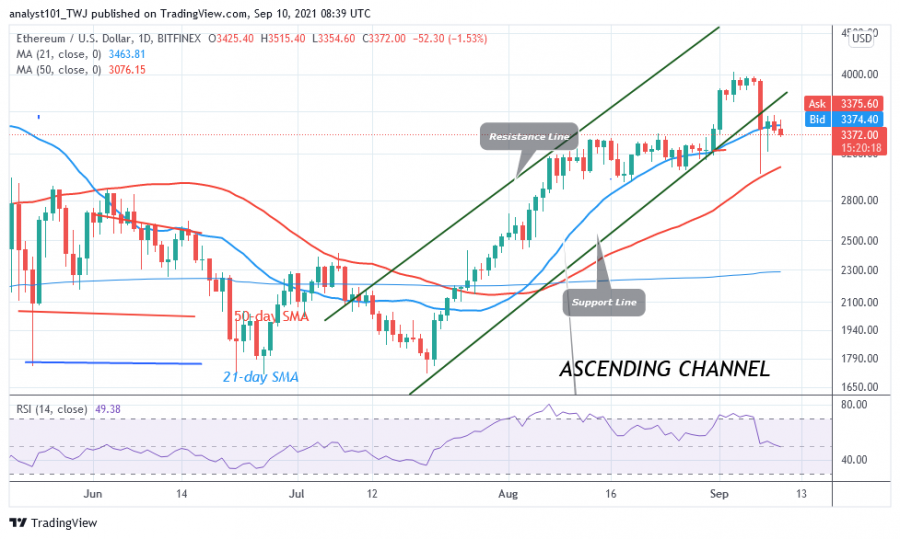
Despite the recent breakdown, the price of Ethereum (ETH) has continued its downward trend. This latest decline is due to the rejection of the resistance at $3,515.40.
Buyers previously pushed the altcoin into the resistance zone, but failed to continue the bullish momentum. Consequently, the bulls were overwhelmed by the bears as the market continued its downward movement. If the selling pressure continues, Ether will fall to the lows of $3,280. On the daily chart, if the price falls to the low of $3,280, the altcoin will find support above the 50-day line SMA. The uptrend will continue if the 50-day line SMA holds. However, if the price falls below the 50-day line SMA, the downtrend will resume.
Ethereum indicator analysis
Ethereum price is at the 49 level of the Relative Strength Index for period 14, indicating that there is a balance between supply and demand. When the Ether price is below the moving averages, it indicates that further selling pressure is imminent. ETH /USD has fallen below the 20% area of the daily stochastic. It is said that Ethereum is reaching the oversold area. There could be a change in trend.

Technical indicators:
Major Resistance Levels - $4,500 and $5,000
Major Support Levels - $3,500 and $3,000
What is the next direction for Ethereum?
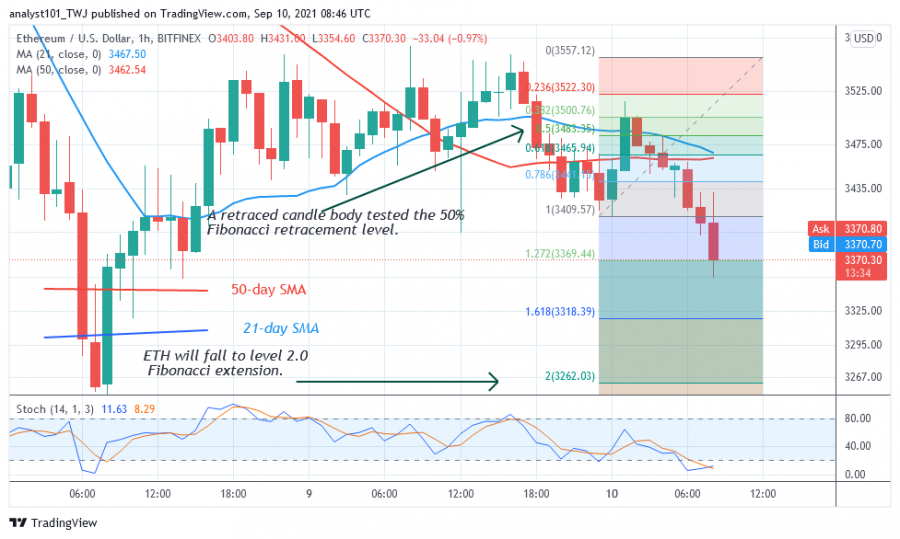
On the 4-hour chart, Ethereum is in a downtrend. Selling pressure has resumed as the price has fallen below the moving averages. Meanwhile, the downtrend from September 9 has shown a candle body testing the 50% Fibonacci retracement level. The retracement suggests that Ethereum could fall to the 2.0 Fibonacci extension level or the $3,262 level.

Disclaimer. This analysis and forecast are the personal opinions of the author and are not a recommendation to buy or sell cryptocurrency and should not be viewed as an endorsement by CoinIdol. Readers should do their research before investing funds.
Price
News
Price
Price
Price

(0 comments)