Dogecoin Attempts To Recover To $0.07 As Demand And Supply Reach Equilibrium

Dogecoin (DOGE) price is in a downtrend as the altcoin drops below the moving average lines.
Dogecoin (DOGE) Price Long Term Forecast: Bearish
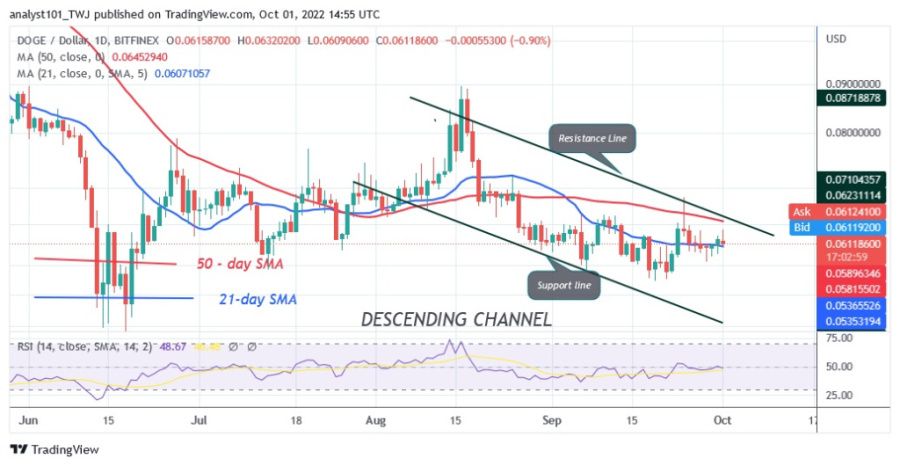
On September 24, the price of DOGE broke above the 50-day line SMA and the 21-day line SMA. The upward momentum was pushed back at a high of $0.068. The cryptocurrency fell sharply below the moving average lines and reached the low of $0.057.
The cryptocurrency is currently trading between $0.057 and $0.066. Today, the price of DOGE is rising above the 21-day line SMA and trying to reach the recent highs. However, selling pressure may resume if DOGE deviates from the moving average lines. A break below $0.057 support would send the altcoin back to the previous low at $049. Meanwhile, DOGE is trading at $0.061 at the time of writing.
Dogecoin (DOGE) Indicator Reading
DOGE is at level 49 on the Relative Strength Index for period 14. RSI indicates that there is a balance between supply and demand. DOGE is trading between the moving average lines and may be back in a range. The market is in a bearish momentum as it is below the 80% area of the daily stochastic. The 21-day line SMA and the 50-day line SMA are sloping south, indicating a downtrend.
Technical Indicators:
Key resistance levels - $0.08 and $0.10
Key support levels - $0.07 and $0.05

What is the next direction for Dogecoin (DOGE)?
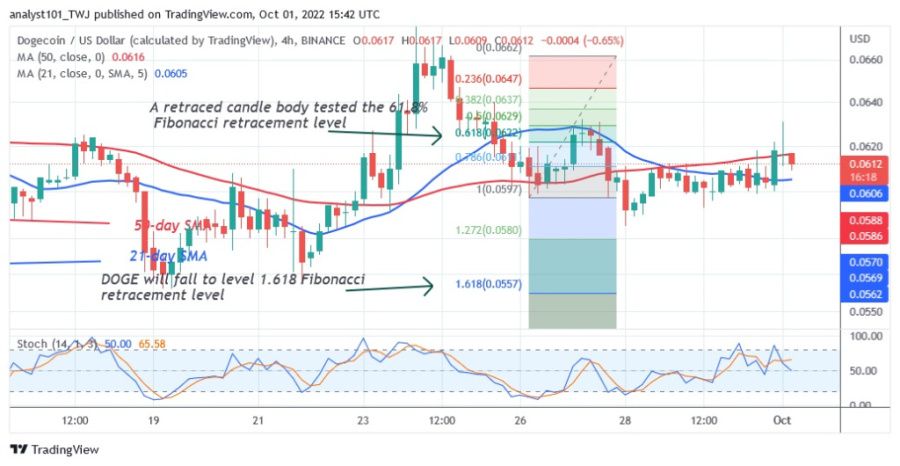
Dogecoin will likely continue to fall as it turns away from its recent high. On September 26, a bearish candlestick tested the 61.8% Fibonacci retracement level. The retracement suggests that DOGE will fall to the 1.618 Fibonacci extension level or the $0.055 level.

Disclaimer. This analysis and forecast are the personal opinions of the author and are not a recommendation to buy or sell cryptocurrency and should not be viewed as an endorsement by Coin Idol. Readers should do their own research before investing in funds.
Price
News
Price
News

(0 comments)