Weekly Cryptocurrency Price Forecast: Coins Have to Continue to Surge after Breaking the Downtrend Line

After the recent surge in price by BTC, other crypto currencies are making positive moves after attaining a bullish break. Binance Coin, NEO, Bitcoin SV are making positive moves except for Stellar and IOTA.
The selling pressures are being exhausted as the bulls take control of the price. The bullish market can equally be sustained if buyers are introduced at the demand zones.
BNB/USD Major trend: Bullish
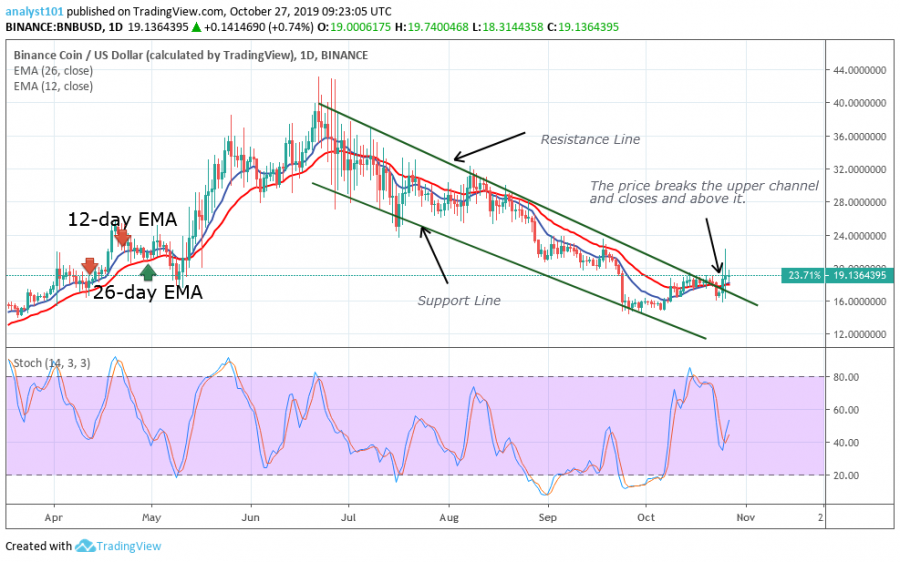
On October 24, the BNB price finally broke the resistance line of the descending channel which indicates a positive sign. This may signal the end of the downtrend if the bulls sustain the price above the channel. The market is above the 40% range of the daily stochastic indicator which means that price is in a bullish momentum. Nevertheless, from the price action, if the bulls break above the previous highs of $20 and $24 price levels, the pair will be out of the downtrend zone.
NEO/USD Major trend: Bullish
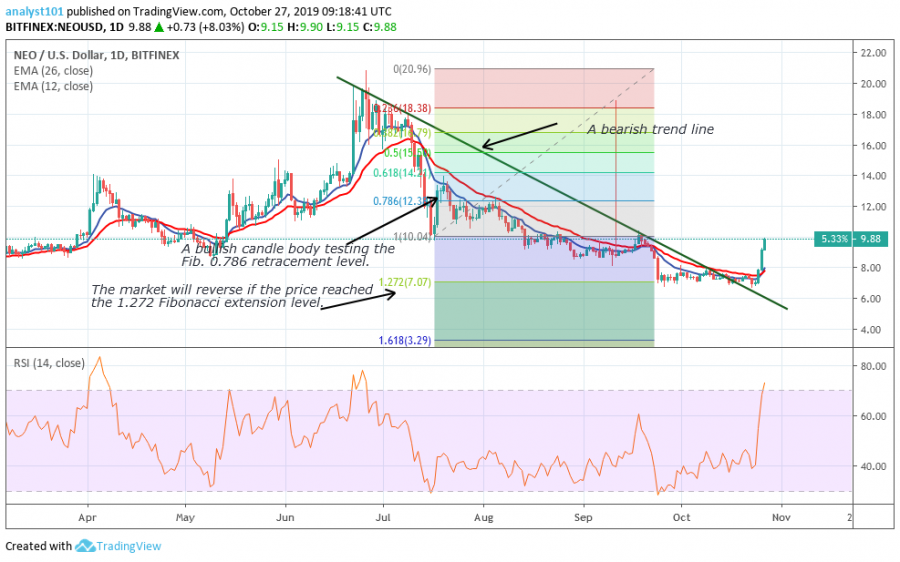
The NEO/USD pair has made a more positive move than Binance Coin as the bulls took control of price. The coin will be out of the downtrend zone if it overcomes the resistance levels of $10 and $ 12. The market is approaching the overbought region of the Relative Strength Index period 14 level70. In other words, the market is in the bullish trend zone. The Fibonacci tool confirms that the market will reverse at the 1.272 extension level because a bullish candle body tested the 0.786 retracement level.
XLM/USD Major trend: Ranging
In October, Stellar has been consolidating above the $0.060 support level after the last bearish impulse. The bulls and the bears are undecided about the direction of the market for the past month. The 12-day and 26-day EMAs are trending horizontally indicating that price is in a sideways movement. According to the Fibonacci tool, Stellar may as well reverse at the 1.272 extension level. 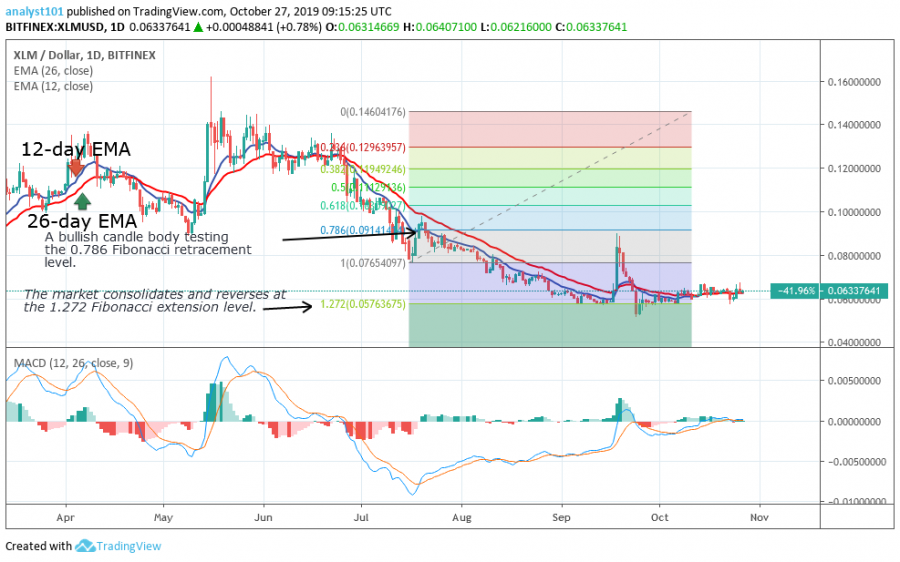
BSV/USD Major trend: Bullish
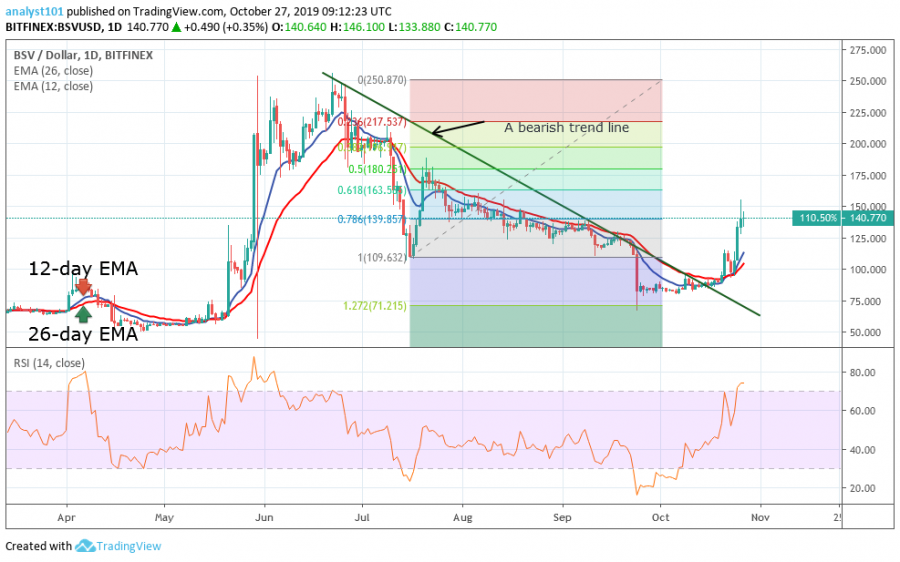
Bitcoin SV is making another positive move as the price breaks the bearish trend line and reaches the previous highs. Presently, it is facing resistance at the $150 price level. The coin is in the bullish trend zone. Nevertheless, if the price continues its upward move, and the $150 and $175 resistance levels are broken, the coin will attain a previous high of $250 supply zone. The market is trading in the overbought region of the Relative Strength Index period 14 levels 69.
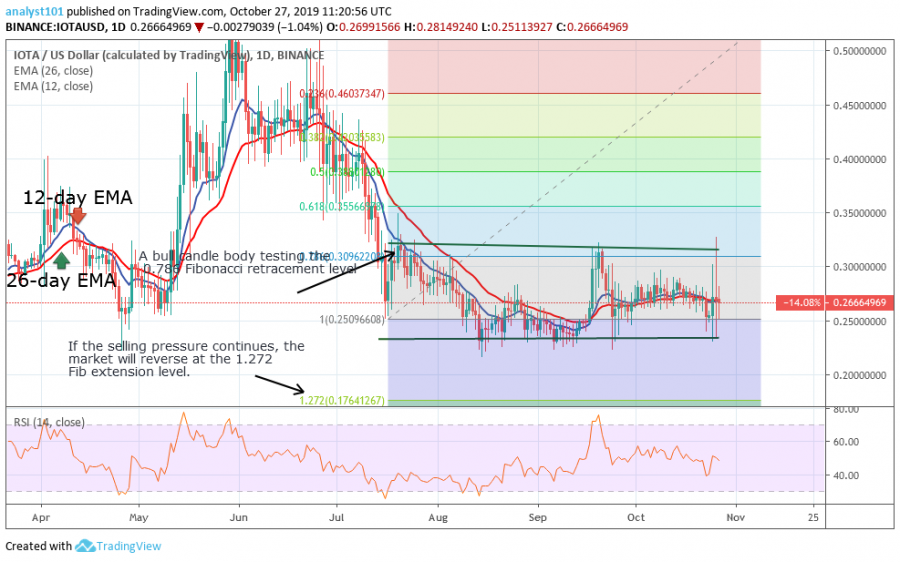
IOTA/USD Major trend: Ranging
In October, the IOTA/USD pair has been consolidating in a tight range. The market fluctuates between the levels of $0.25 and $0.28. This consolidation in a tight range was as a result of the failure of the bulls to break the $0.30 resistance level. Likewise, the bears were unable to break below the $0.25 support level. Meanwhile, the Fibonacci tool indicates that IOTA is likely to fall to the 1.272 extension level. The Relative Strength Index period 14 level 47 explains that IOTA is in a sideways move.
Disclaimer. This analysis and forecast are the personal opinions of the author are not a recommendation to buy or sell cryptocurrency and should not be viewed as an endorsement by CoinIdol. Readers should do their own research before investing funds.
Coin expert
Price
Price
Coin expert
Price

(0 comments)