Chainlink Holds Above $13 With Stable Price Movement

The price of Chainlink (LINK) is in a downtrend, but has resumed its sideways movement above $13 support.
Chainlink (LINK) price long-term analysis: bearish
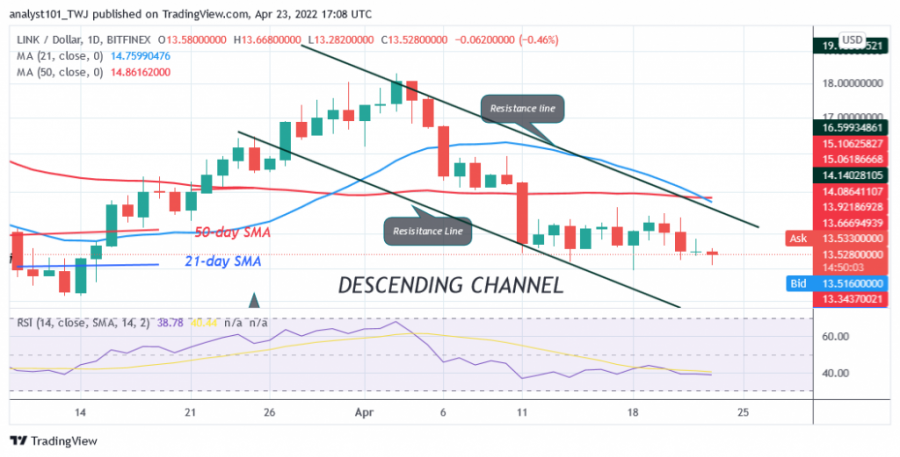
Over the past two weeks, Chainlink has traded below the moving averages and above the $13.53 support. Buyers managed to defend the current support, but the upside was limited below the $15 resistance zone.
By the way, LINK /USD is trading in a narrow range between $13.50 and $15. The cryptocurrency will see a rally or a breakdown if the sideways movement continues. A price recovery will catapult the altcoin above the moving averages, for example. Bullish momentum above the moving averages will extend to the $18 high. Similarly, Chainlink will regain the previous low at $12 if the current support is broken.
Chainlink (LINK) Indicator Reading
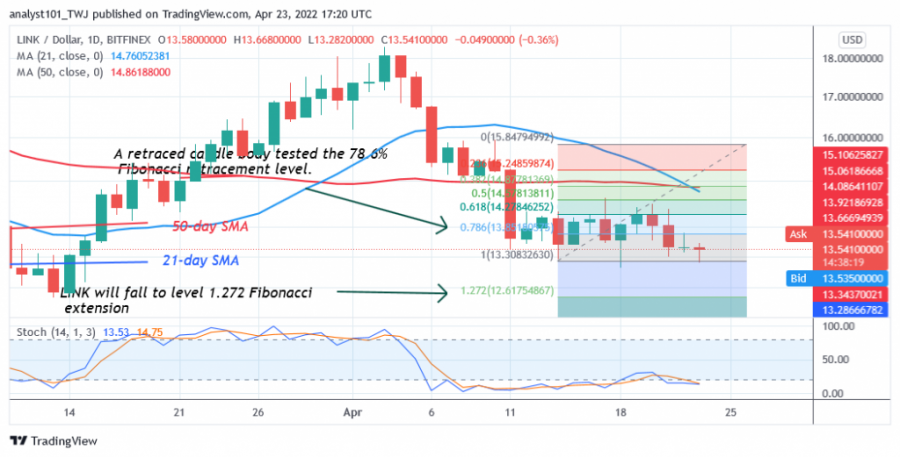
Chainlink has fallen to level 38 on the Relative Strength Index for the 14 period. The recent decline has brought the altcoin close to oversold territory. LINk's price bars are below the moving averages, which may lead to a decline in the altcoin. The daily stochastic indicates that the altcoin is below the 20% range of the price indicator. The market has reached the oversold region.
Technical Indicators:
Key resistance levels - $55 and $60
Important support levels - $20 and $15

What is the next move for Chainlink (LINK)?
Chainlink has been in a sideways movement while the current selling pressure is easing. Meanwhile, on April 11, the downtrend; a retraced candlestick tested the 78.6% Fibonacci retracement level. The retracement suggests that LINK will fall to the Fibonacci extension level of 1.272 or $12.61. The price action shows that the altcoin is fluctuating above the $13 support.

Disclaimer. This analysis and forecast are the personal opinions of the author and are not a recommendation to buy or sell cryptocurrency and should not be viewed as an endorsement by Coin Idol. Readers should do their own research before investing funds.
News
Price
Price
Price
Price

(0 comments)