Cardano Fluctuates But The Price Is Below The $0.41 Resistance Level

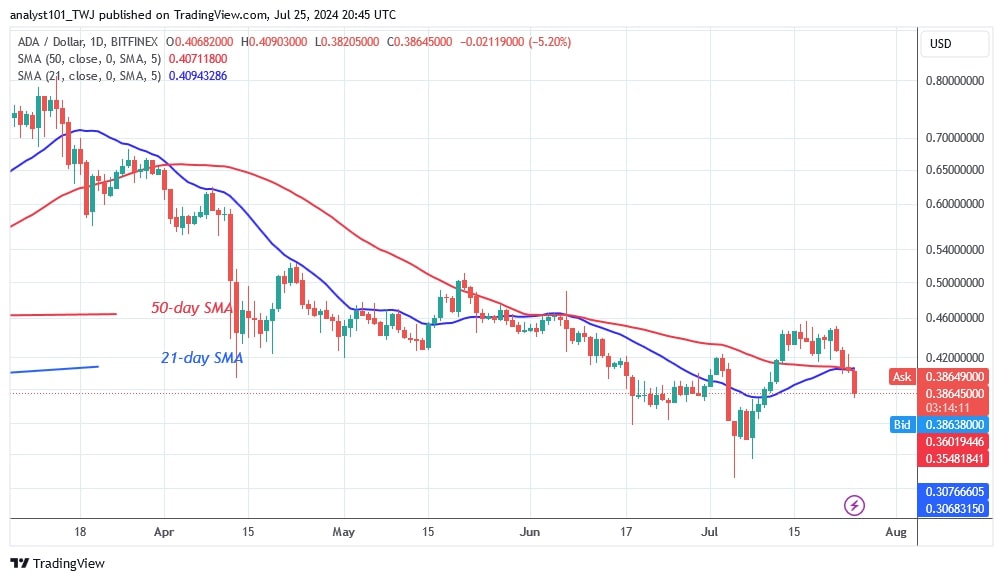
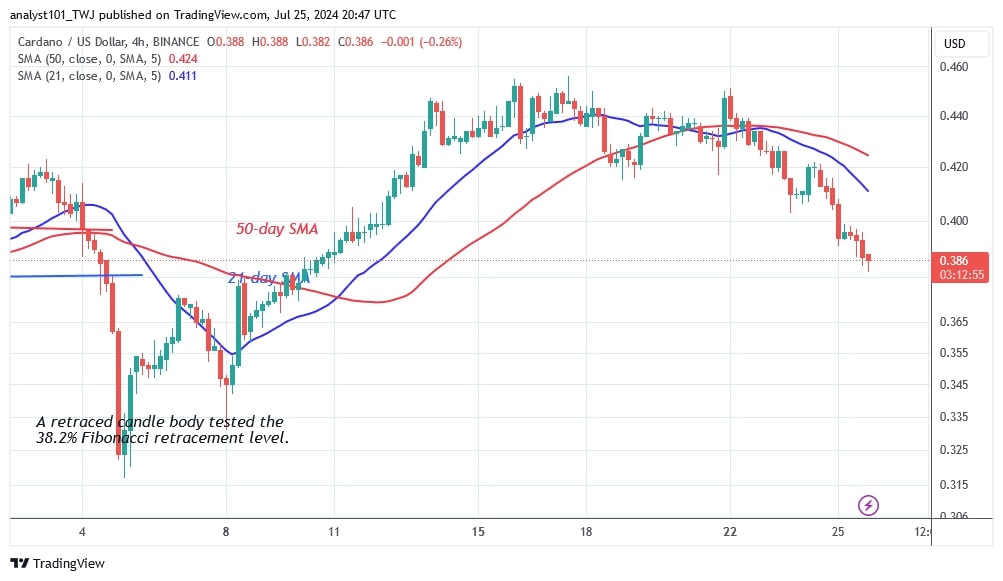
The price of Cardano (ADA) fell below the moving average lines on July 25. After a rejection at the $0.46 resistance zone, the cryptocurrency fell to a low of $0.382.
Long-term forecast for the Cardano price: bearish
The price of the altcoin rose to a high of $0.458 before stalling at this level. Buyers were unable to keep the price above the resistance level of $0.46.
For more than a week as reported by Coinidol.com, the ADA price fluctuated below the $0.46 resistance area while remaining above the moving average lines. The bulls failed to push the price above its recent high, which led to the decline.
Cardano is in a downtrend and could fall to $0.375. The altcoin is trading in the previous range bound zone, between the $0.34 support and below the moving average lines.
Cardano indicator analysis
After the recent dip, the price bars have fallen below the moving average lines, indicating a downtrend. The slide ended in the downtrend zone, with the bulls buying the dips. The moving average lines have delayed the upward correction.
Technical Indicators
Key Resistance Zones: $0.80, $0.85, and $0.90
Key Support Zones: $0.50, $0.45, and $0.40

What's next for ADA?
After the recent plunge, the price bars have fallen below the moving average lines, indicating a downtrend. The decline ended in the bearish trend zone, with bulls buying on dips. The moving average lines have slowed the upward correction.

Disclaimer. This analysis and forecast are the personal opinions of the author and are not a recommendation to buy or sell cryptocurrency and should not be viewed as an endorsement by CoinIdol.com. Readers should do their research before investing in funds.
Price
Price
News
News
Price

(0 comments)