Bitcoin Price Analysis: BTC Remains Bearish, and May Go Further Downwards

Bitcoin (BTC) is in a sideways move at the bottom. A break down at the bottom will mean further selling
Bitcoin price Long-term Prediction: Bearish
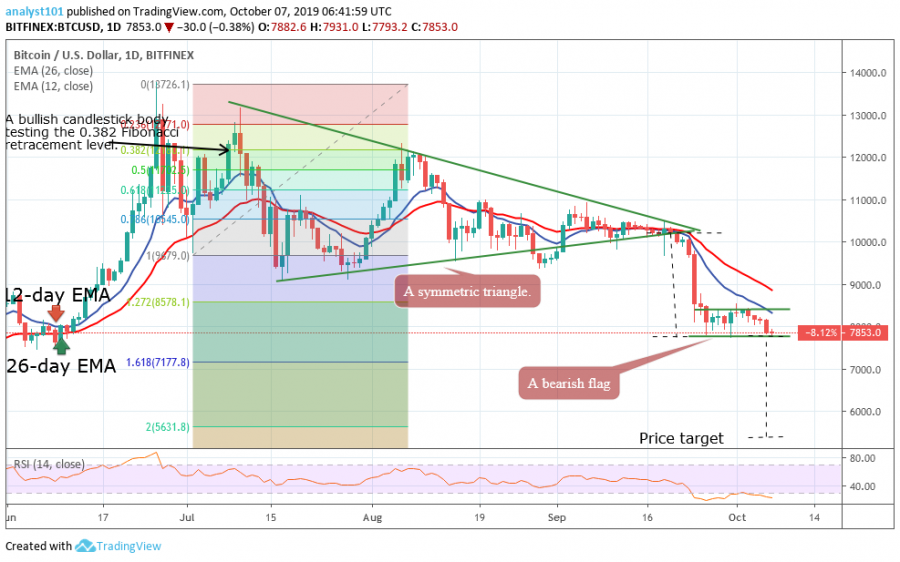
On September 24, the current bearish impulse broke the $9,000 support level to reach a low of $7,700. On October 7, the market is consolidating between the levels of $7,700 and $8,500, attempting to form another price pattern.
A bearish flag pattern has been formed which means Bitcoin price is likely to make a downward move to the previous support level. A bearish flag pattern is a continuation pattern where the previous trend is likely to continue its downward move after the formation of the pattern. In other words, if there is a break down in the bearish flag pattern, the market will fall.
Bitcoin Indicator Reading
From the Fibonacci tool, the swing low is taken on July 2, while the upper swing high is on June 25. On July 2 during price upward correction, the last bullish candlestick body tested the 0.382 Fibonacci retracement level. This gives us the clue that Bitcoin is likely to fall to the low of 1.618 Fibonacci extension level. In other words, Bitcoin will fall to a low of $7,300 price level.
Besides, if the bearish pressure continues, the market may reach another low of 2.618 extension level. The 12-day and 26-day EMAs are trending southward indicating that the market is falling. The Relative Strength Index period 14 level 25 indicates that the market is in the oversold region suggesting bulls to take control of price.

Key Supply Zones: $10,000, $11,000, $12,000
Key Demand zones: $7, 000, $6, 000, $5,000
What is the next direction for Bitcoin?
The BTC/USD pair had been on a downward move for the last five months. The market hovers above the $10,000 price level for three months leading to the formation of a symmetrical triangle. It is a situation where the supply and demand reaches equilibrium.
The equilibrium status does not last for long as the sellers overwhelm the buyers and the market falls to another low above $8,000 price level. The market fell to a period of consolidation to form a bearish flag. The price is likely to pause and continue its original downward move. In other words, the next direction for Bitcoin is likely to be the low above $5,300 support level. The price target is calculated by measuring the distance between the previous swings high to the swing low of the flag pole.
Disclaimer. This analysis and forecast are the personal opinions of the author, are not a recommendation to buy or sell cryptocurrency and should not be viewed as an endorsement by CoinIdol. Readers should do their own research before investing funds.
Price
Price
Coin expert
Coin expert
Coin expert

(0 comments)