Bitcoin Falls Below $106,000 And Threatens To Fall Further
Updated: Jun 04, 2025 at 12:00

The price of Bitcoin (BTC) has fallen below the crucial 21-day SMA support.
Bitcoin price long-term prediction: bearish
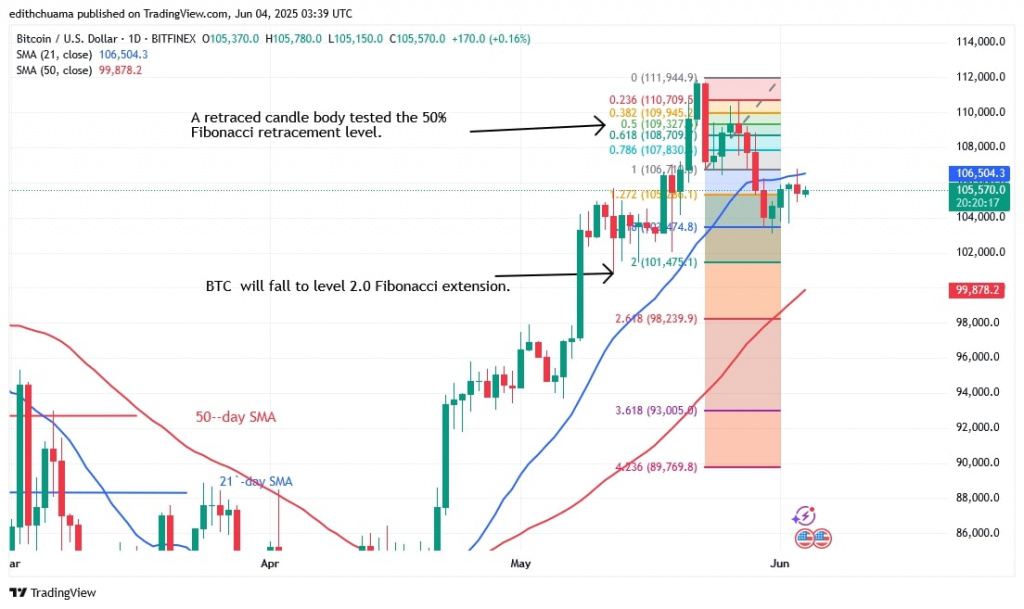
The largest cryptocurrency fell from a high of $111,880 to a low of $103,460 before starting to rise again. The 21-day SMA barrier prevented the upward correction.
BTC's break below the 21-day SMA support and subsequent rejection or retest of the 21-day SMA indicate a further decline. Bitcoin is expected to fall above the 50-day SMA support or the psychological level of $100,000.
According to the price indicator, the 50% Fibonacci retracement will drop Bitcoin to the 2.0 Fibonacci extension level or a low of $101,475.10. Buyers are expected to vigorously defend the psychological price threshold of $100,000.
However, once Bitcoin breaks above the 21-day SMA barrier, it will resume its uptrend. The current prce of Bitcoin is $105,598, according to Coinidol.com.
BTC price indicators analysis
The price of Bitcoin fell below the 21-day SMA support on 29 May, indicating that a downtrend has resumed. The cryptocurrency value is falling along the 50-day SMA support. The lines representing the moving averages are moving north despite the recent decline.
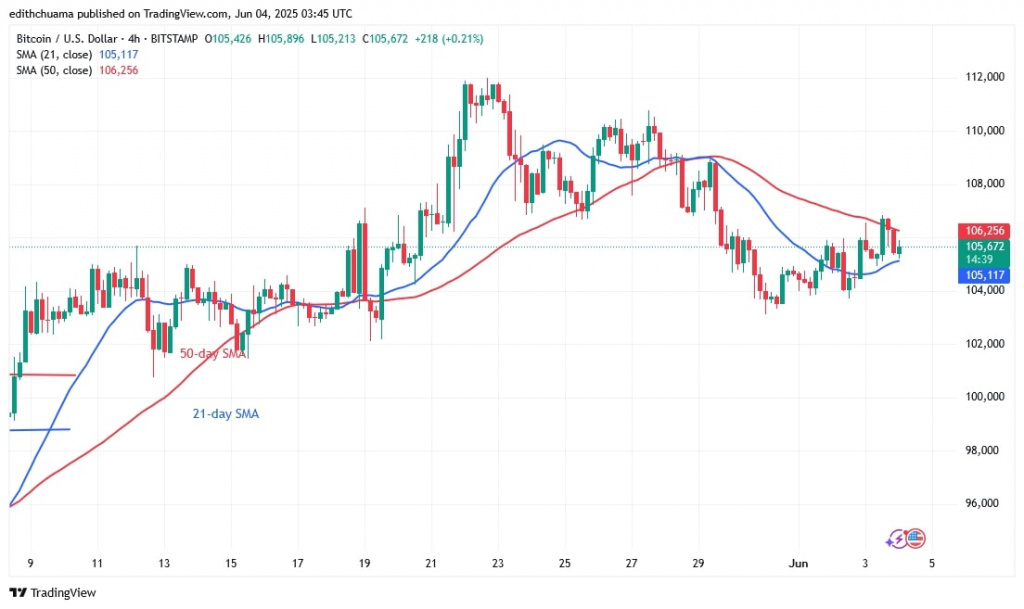
However, on the 4-hour chart, the moving average lines are sloping downwards, indicating the current downtrend.
Technical indicators
Key supply zones: $108,000, $109,000, $110,000
Key demand zones: $90,000, $80,000, $70,000

What's the next move for Bitcoin?
Bitcoin has started a move between the price levels of $103,000 and $107,000 after falling to a low of $104,304. The Bitcoin price has been moving in a range since the 31st of May as the trend is determined. If the current support is broken, Bitcoin can be expected to fall further.

Disclaimer. This analysis and forecast are the personal opinions of the author. They are not a recommendation to buy or sell cryptocurrency and should not be viewed as an endorsement by CoinIdol.com. Readers should do their research before investing in funds.
Price
Price
News
News
Coin expert

(0 comments)