Bitcoin Remains At $26,500 In A Fluctuation Range
Updated: May 22, 2023 at 11:32

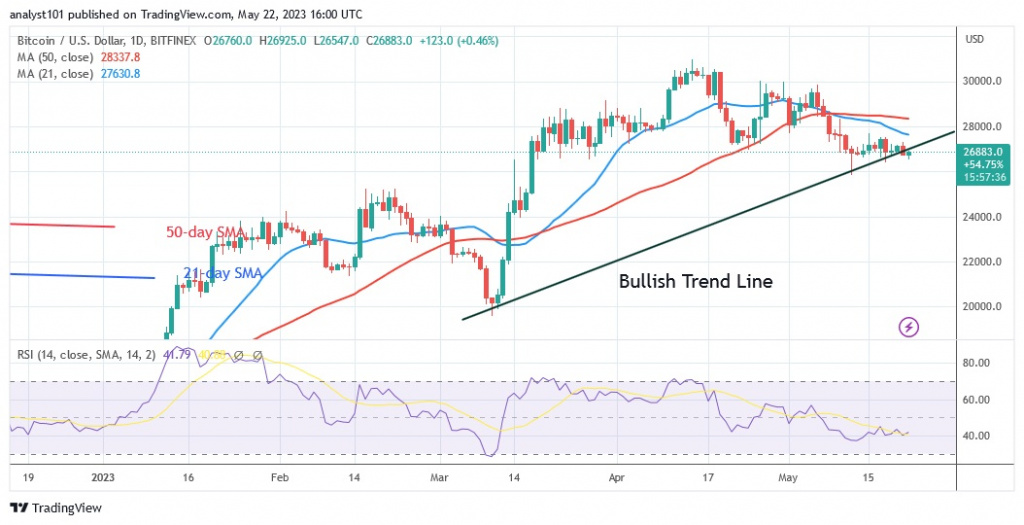
Bitcoin (BTC) is still in a downtrend below the moving average lines.
Bitcoin price long-term forecast: bearish
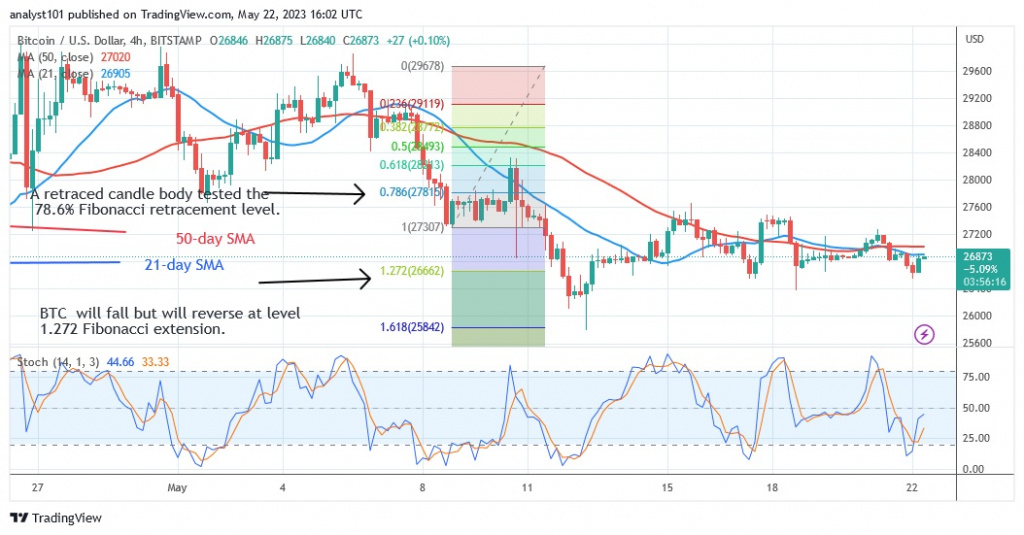
The price range for the cryptocurrency asset is currently limited to $26,400 to $27,500. Price movement is minimal due to the prevalence of Doji candlesticks, small-size indecisive candlesticks. If the Doji candlesticks persist, Bitcoin will move in a range for days. At the time of writing, it is trading at $26,842. The candlesticks show that both buyers and sellers are unsure of which direction the market is heading. However, if the current support is broken, the BTC price would fall back to its previous low of $25,857. On the other hand, if the cryptocurrency price rises back above the existing support, Bitcoin will resume a positive trend. The moving average lines will be crossed or the resistance at $28,000 will be broken by the positive momentum. Bitcoin will return to its previous high of $30,000.
Bitcoin indicator display
Bitcoin is at level 41 of the Relative Strength Index for period 14. As Bitcoin consolidates above the current support, the RSI has remained stable. As long as Bitcoin is in the bearish trend zone, a decline is likely. The price bars are below the moving average lines, which implies a decline in the cryptocurrency. The stochastic barrier of 25 on the daily basis indicates that the price of Bitcoin is trending upwards.

Technical indicators:
Key resistance levels - $30,000 and $35,000
Key support levels - $20,000 and $15,000
What is the next direction for BTC/USD?
BTC/USD is currently in a range as it remains above the $26,400 support. It is likely that the bitcoin value will remain in a range for a few days as Doji candlesticks are in place. The cryptocurrency value will develop when the boundaries of the trading range are crossed or when Bitcoin rises above the current support.

Disclaimer. This analysis and forecast are the personal opinions of the author and are not a recommendation to buy or sell cryptocurrency and should not be viewed as an endorsement by CoinIdol. Readers should do their research before investing in funds.
News
Price
News
Price
Price

(0 comments)