Bitcoin Recaptures The $70,000 Threshold And Resumes Its Ascent
Updated: Apr 11, 2024 at 19:01

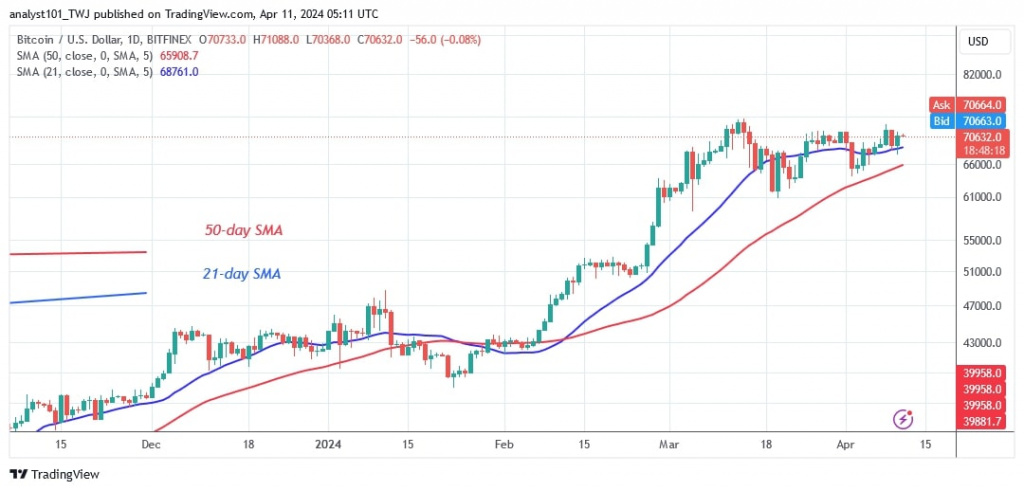
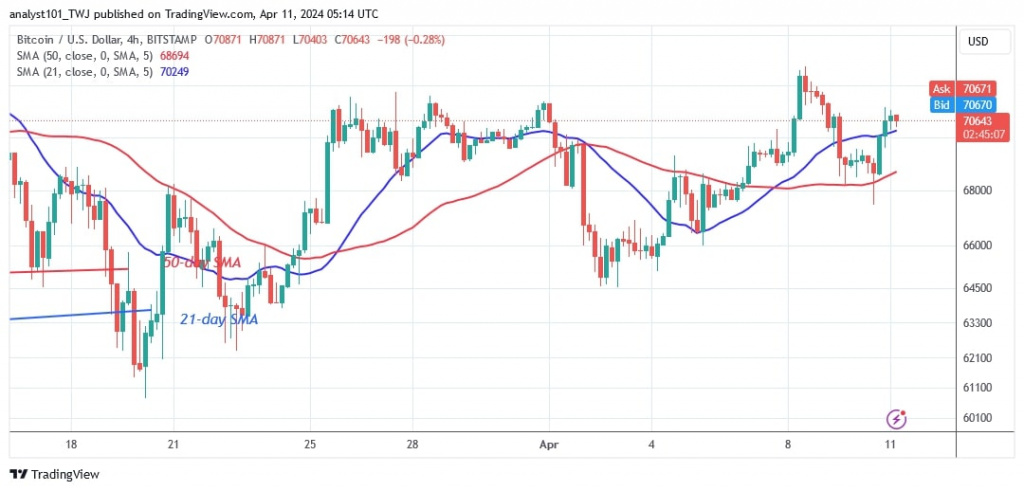
The price of Bitcoin (BTC) has been trading above the 21-day SMA or $70,000 support since April 4, 2024.
Long-term forecast for the Bitcoin price: bullish
On April 4, the largest cryptocurrency reclaimed the psychological price level of $70,000, with buyers aiming to take Bitcoin to its previous high. The upward movement is encountering initial resistance at a high of $72,762. In other words, Bitcoin is trading in a limited range of $70,000 to $73,000.
If Bitcoin rises above the 21-day SMA or the $70,000 support, the resistance levels of $72,762 and $73,666 will be breached. The bullish momentum generated by the rally will take Bitcoin to a high of $80,000. Bitcoin will fall to lows of $66,000 and $60,000 respectively if it breaks either the $70,000 support level or the 21-day SMA. Bitcoin is currently worth $70,778.
Bitcoin indicator reading
The horizontal sloping moving average lines have been in place since the end of the uptrend on March 14. The price bars have fluctuated both below and above the moving average lines. The movement of the BTC price has been slowed by the presence of doji candlesticks.
Technical indicators:
Key resistance levels – $70,000 and $80,000
Key support levels – $50,000 and $40,000

What is the next direction for BTC/USD?
Bitcoin is trading above the 21-day SMA and below resistance at $73,666 in anticipation of an uptrend. Doji candlesticks are slowing the cryptocurrency's upside momentum. A rally or breakout will bring the cryptocurrency into a trend.

Disclaimer. This analysis and forecast are the personal opinions of the author and are not a recommendation to buy or sell cryptocurrency and should not be viewed as an endorsement by CoinIdol.com. Readers should do their research before investing in funds.
Price
Price
News
Price
Price

(0 comments)