Bitcoin Price Pauses At $65,000 And Prepares For An Surge
Updated: Oct 27, 2024 at 20:41

Bitcoin (BTC) is trading sideways below the psychological $70,000 mark. Price analysis by Coinidol.com.
Bitcoin price long-term forecast: bullish
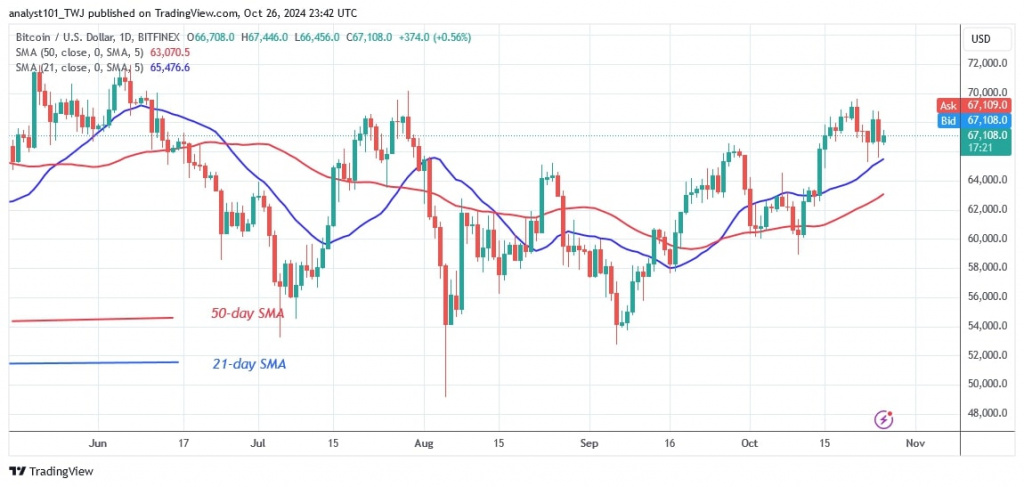
Bitcoin has spent the last 48 hours hovering above the critical support level of $65,000 but below the high of $67,000. Buyers are struggling to defend the crucial support at $65,000.
If the bears manage to break below the critical support, Bitcoin will fall below the moving averages. It will surpass the 50-day SMA or the low at $62,000.
However, a move higher is likely as the BTC price remains above the moving average lines. If Bitcoin price rises above $67,000, it will return to its high of $70,000. The price action is currently static as doji candlesticks can be seen. Bitcoin is trading in a narrow range and has fallen to a low of $66,850.
BTC indicator reading
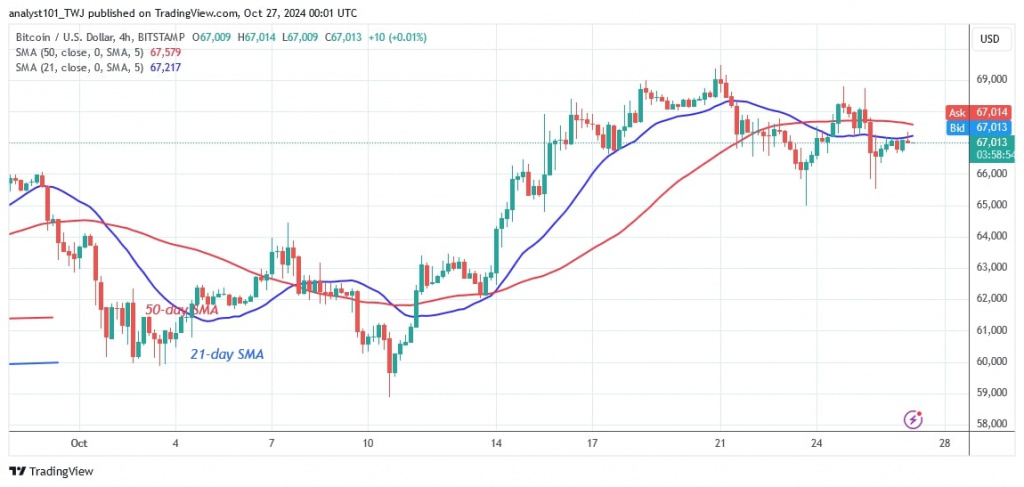
Bitcoin has remained stable with the price bars above the moving average lines. Bitcoin will crash as soon as the bears break below the moving average lines. On the 4-hour chart, the price bars are below the moving average lines, indicating a current decline. Bitcoin will fall if it continues to be rejected at its high of $67,000.
Technical indicators:
Resistance Levels – $70,000 and $80,000
Support Levels – $50,000 and $40,000

What is the next direction for BTC/USD?
On the 4-hour chart, BTC is moving downwards. Currently, the decline has paused above the support level of $65,000 below the moving average lines. Today, the uptrend was halted at the moving average lines or the high of $67,000. Doji candlesticks have appeared, causing a gradual price movement.
Disclaimer. This analysis and forecast are the personal opinions of the author. They are not a recommendation to buy or sell cryptocurrency and should not be viewed as an endorsement by CoinIdol.com. Readers should do their research before investing in funds.
Price
News
Price
Price
News


(0 comments)