Bitcoin Cash Is in a Downtrend as Bulls and Bears Remain Indifferent
Updated: Jul 28, 2022 at 11:54

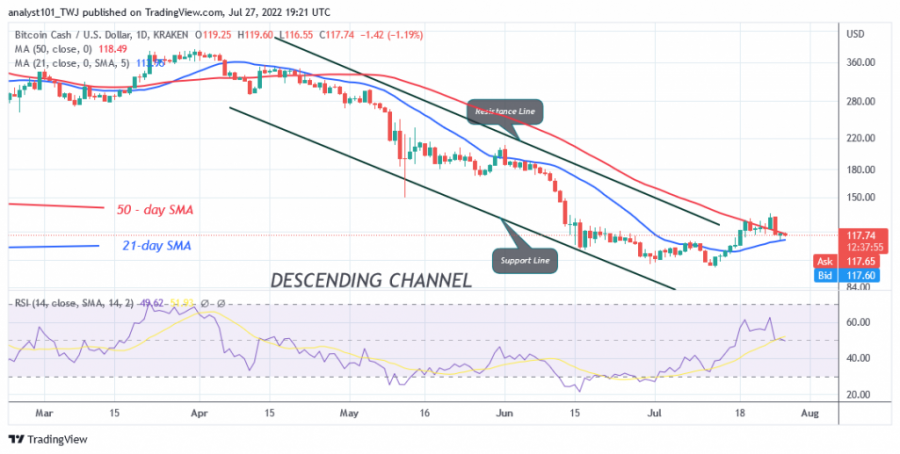
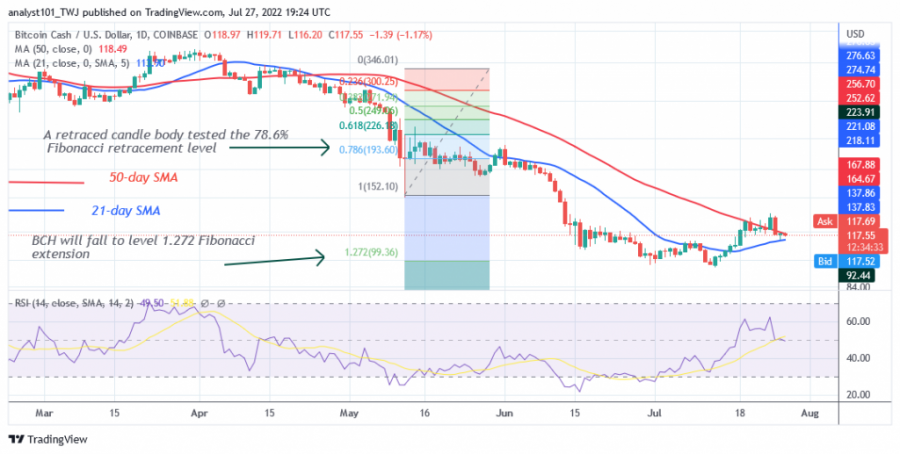
The price of Bitcoin Cash (BCH) resumed its downward correction as it fell below the 50-day line SMA. The cryptocurrency is now fluctuating between the moving average lines. The altcoin is above the 21-day line SMA but below the 50-day line SMA.
The market will change when the moving average lines are broken. The market will trend up if the bulls break the 50-day line SMA and the upward momentum is maintained. If the bears break below the 21-day line SMA, the market will fall to a low of $95. In the meantime, the price movement is insignificant as small body candlesticks are indecisive. These candles indicate that buyers and sellers are undecided about the direction of the market.
Bitcoin Cash indicator reading
The cryptocurrency is at level 50 of Relative Strength for the period 14, indicating that there is a balance between supply and demand. BCH price is below the 80% area of the daily stochastic. This means that the market is in a bearish momentum. The cryptocurrency price is above the 21-day line SMA, but below the 21-day line SMA, indicating a possible movement within a trading range.

Key Resistance Zones: $130 and $150
Key Support Zones: $120 and $100
What is the next move for Bitcoin Cash?
Bitcoin Cash has resumed its uptrend, but faces rejection at the recent high. The cryptocurrency is in a downward correction as it fluctuates between moving average lines. The price movement will depend on whether the price breaks the moving average lines.

Disclaimer. This analysis and forecast are the personal opinions of the author and are not a recommendation to buy or sell cryptocurrency and should not be viewed as an endorsement by Coin Idol. Readers should do their own research before investing funds.
News
Price
Price
News
Coin expert

(0 comments)