Bitcoin Cash Is Stuck Below $640 as It Continues Sideways Move
Updated: Sep 15, 2021 at 09:30

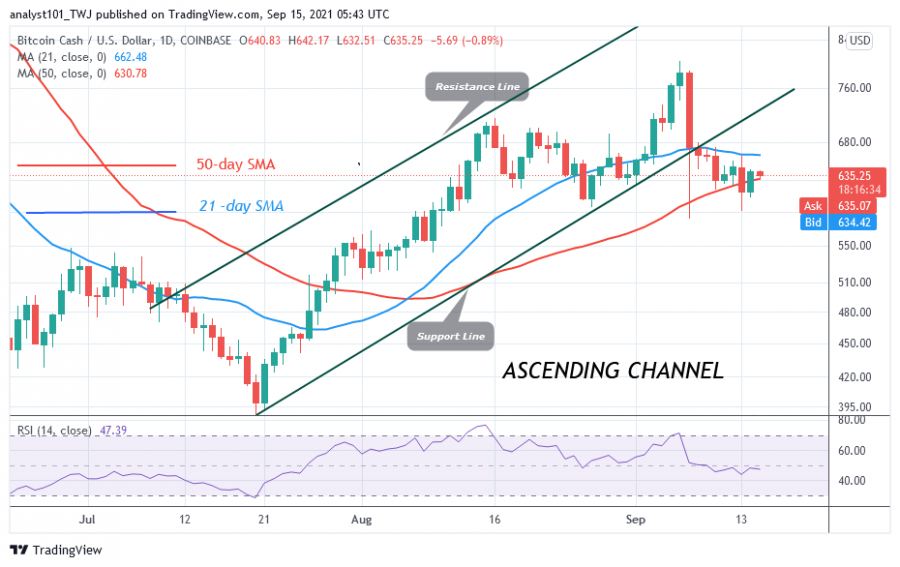
Bitcoin Cash (BCH) is trading marginally above the 50-day line SMA. Over the past 48 hours, the altcoin has struggled to stay above $640 resistance.
Today, BCH is down to $633.60 and it is likely to continue downward. The cryptocurrency risks resuming a downtrend if the bears fall below the 50-day line SMA.
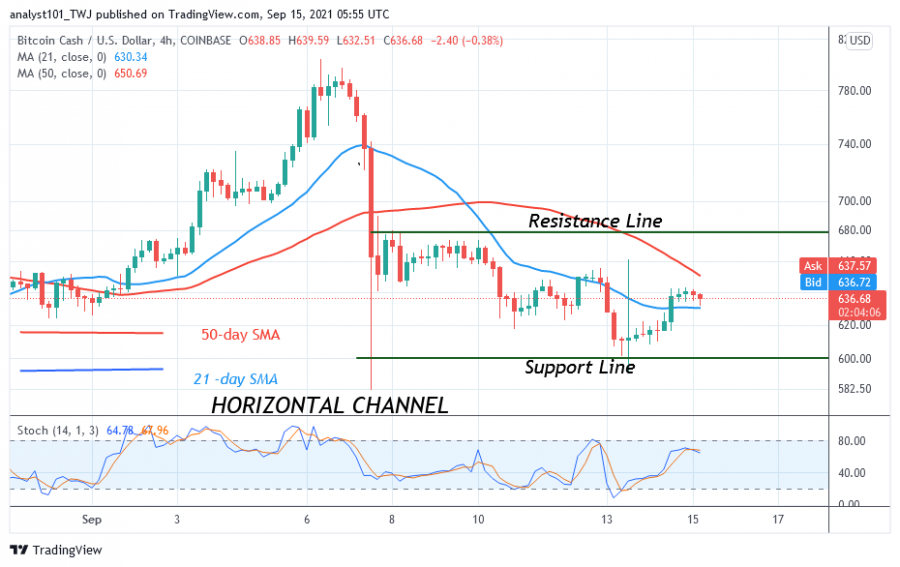
The 21-day line SMA has already been breached and the break of the 50-day line SMA will push BCH into the downtrend zone. In the downtrend zone, the altcoin is capable of falling downwards. If the 50-day line holds against it, BCH /USD will dive back into a trading range between $600 and $680. BCH has been in a trading range since the collapse on September 7.
Bitcoin Cash indicator reading
The cryptocurrency is at the 47 level of the Relative Strength Index for period 14. Bitcoin Cash is in a downtrend zone and below the centre line 50. The altcoin is in a position to fall to the downside. The cryptocurrency value is below the 80% range of the daily stochastic. This suggests that BCH is in a bearish momentum as it is rejected at $640.

Technical indicators:
Major Resistance Levels - $1,800 and $2,000
Major Support Levels - $600 and $400
What is the next move for Bitcoin Cash?
Bitcoin Cash is in a fluctuation range between $600 and $680. The bears previously pushed the cryptocurrency price to the low of $600 while the bulls bought the dips. The bulls failed to push the price past the $640 high as it consolidated in the middle of the price range.

Disclaimer. This analysis and forecast are the personal opinions of the author and are a recommendation to buy or sell cryptocurrency and should not be viewed as an endorsement by Coin Idol. Readers should do their own research before investing funds.
News
Price
Price
News
Coin expert

(0 comments)