Bitcoin Cash Pauses above $415 Support as Bulls Regroup to Resume Upside Momentum

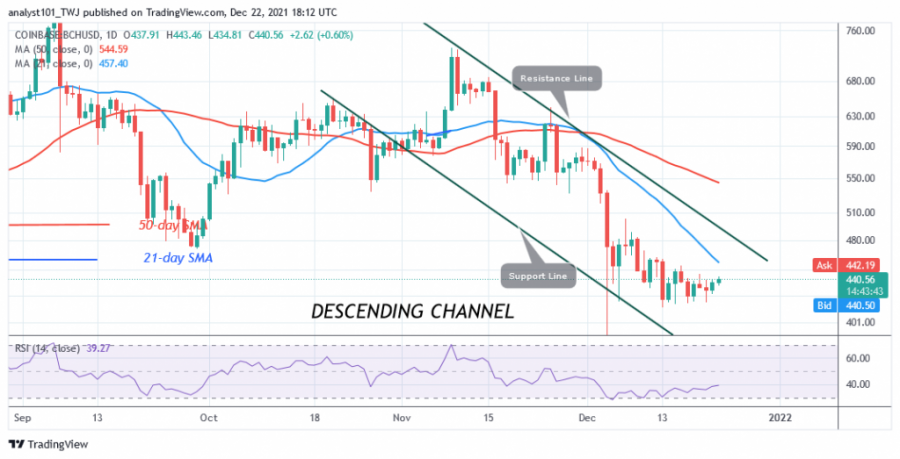
Bitcoin Cash (BCH) has continued to consolidate above $415 support following the downward impulse on December 13. Today, price action was marginal due to the presence of doji candlesticks and spinning tops.
These candlesticks indicate that buyers and sellers are still undecided on the direction of the market. At press time, BCH is trading at $440. A bounce off $440 support will push the altcoin above initial resistance at $470. A subsequent bullish momentum will extend above the $600 and $640 price levels. The bullish scenario is likely if price breaks above the moving averages. The market will trade in a range when price bars below the moving averages.
Bitcoin Cash indicator reading
BCH is at level 34 of the Relative Strength Index for period 14. The altcoin is in the bearish trend zone and could fall to the downside. BCH is above the 30% area of the daily stochastic. The bullish momentum is volatile due to currency fluctuations. The 21-day and 50-day moving averages are sloping south, indicating a downtrend.

Technical Indicators
Key Resistance Zones: $800, $820, $840
Key Support Zones: $500, $480, $460
What is the next move for Bitcoin Cash?
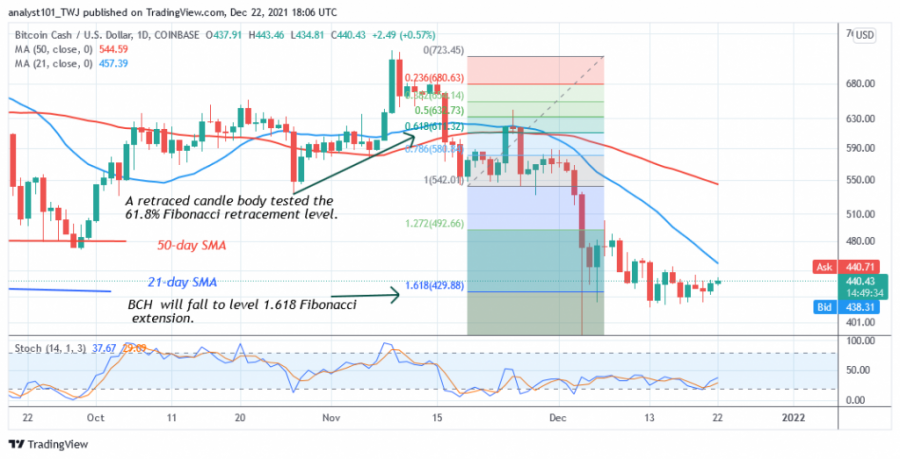
Bitcoin Cash's downtrend has reached its bearish exhaustion. The altcoin is consolidating at the bottom of the chart. Meanwhile, the downtrend from November 18 has a candlestick body testing the 61.8% Fibonacci retracement level. This retracement suggests that BCH will fall to the 1.618 Fibonacci extension level or $429.88. The price action shows that the market is consolidating at the Fibonacci extension and waiting for a possible reversal.

Disclaimer. This analysis and forecast are the personal opinions of the author and are not a recommendation to buy or sell cryptocurrency and should not be viewed as an endorsement by Coin Idol. Readers should do their own research before investing funds.
Price
Coin expert
News
Price
Price

(0 comments)